Scientifically interesting events (newest first)
High-speed stream with clear alpha particles (0.4 - 0.5 AU)
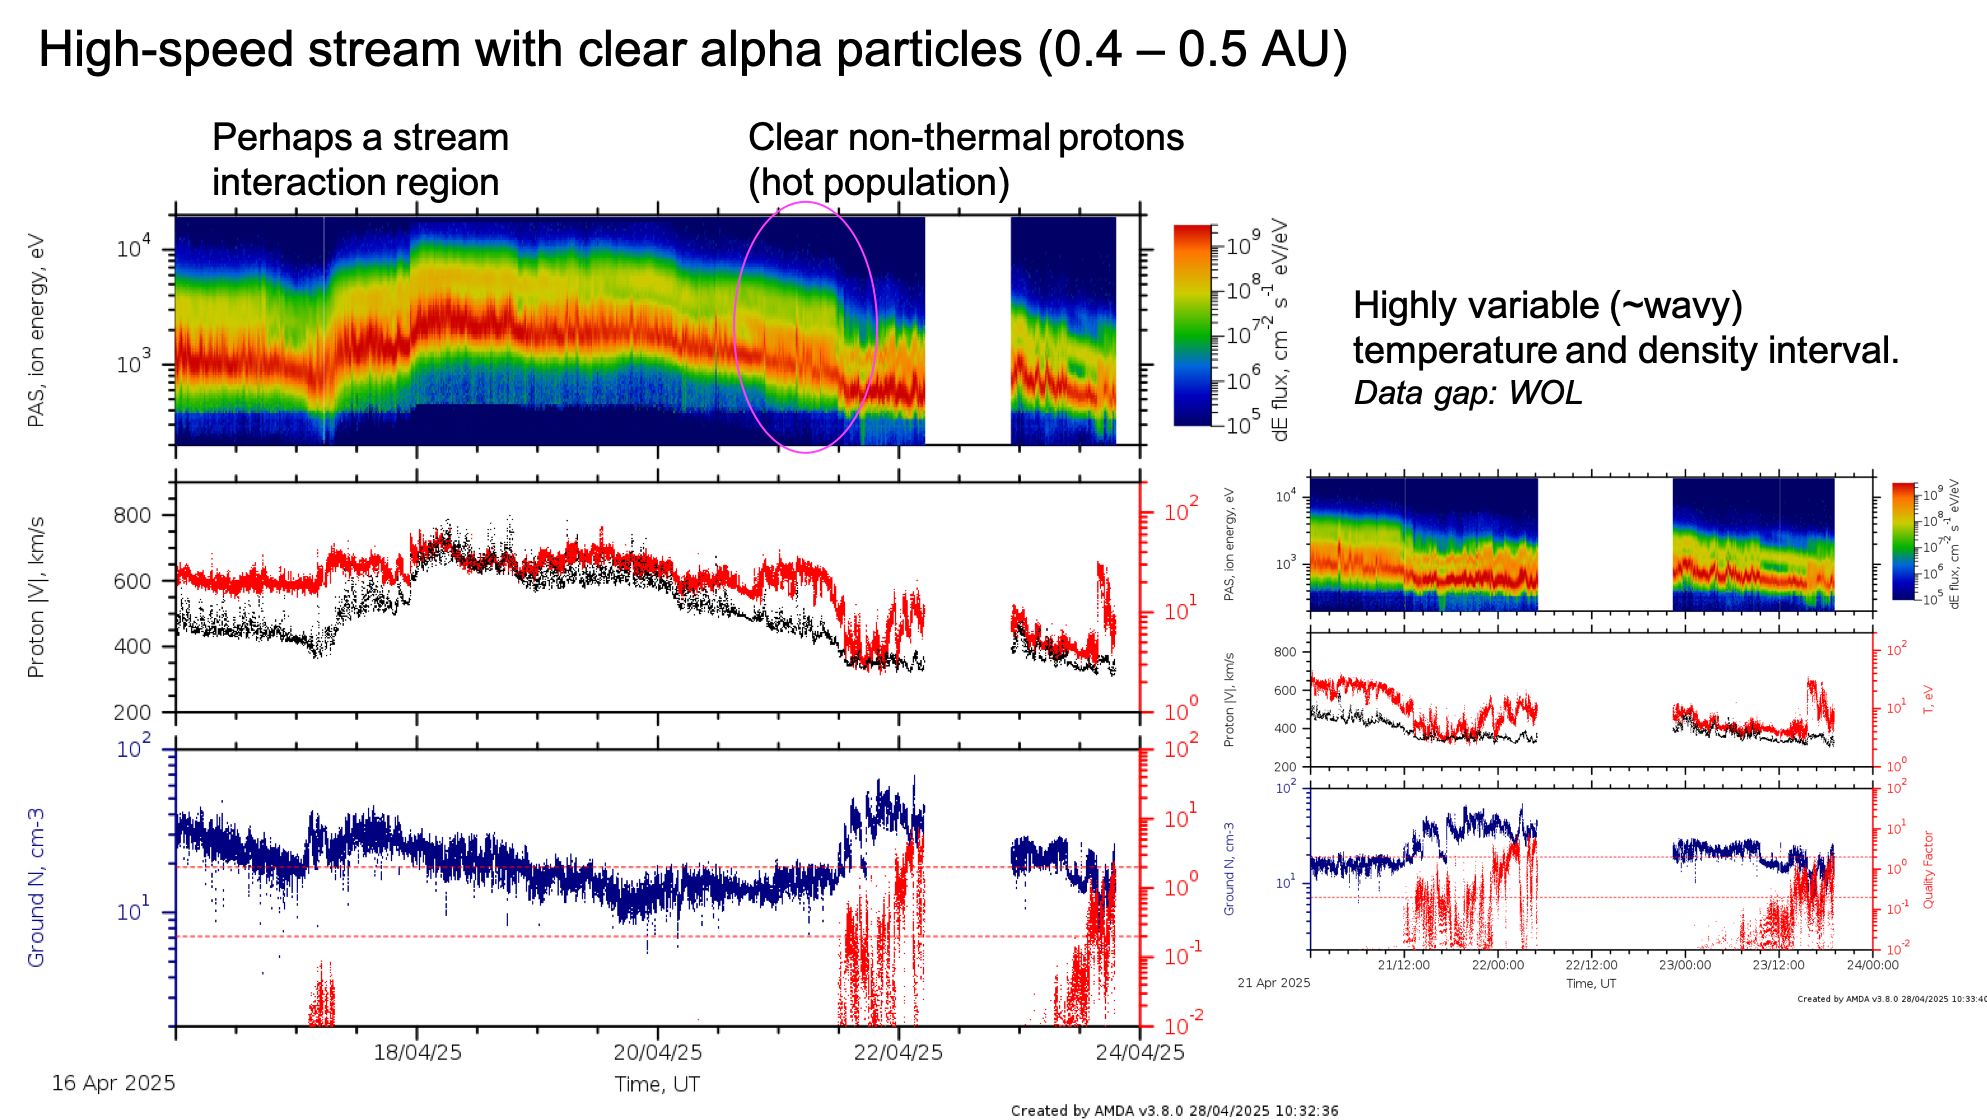
Figure 1. Fast wind. Possibly with a stream interaction region. Highly variable ion moments towards the end of the interval..
Stream interaction region (0.4 AU)
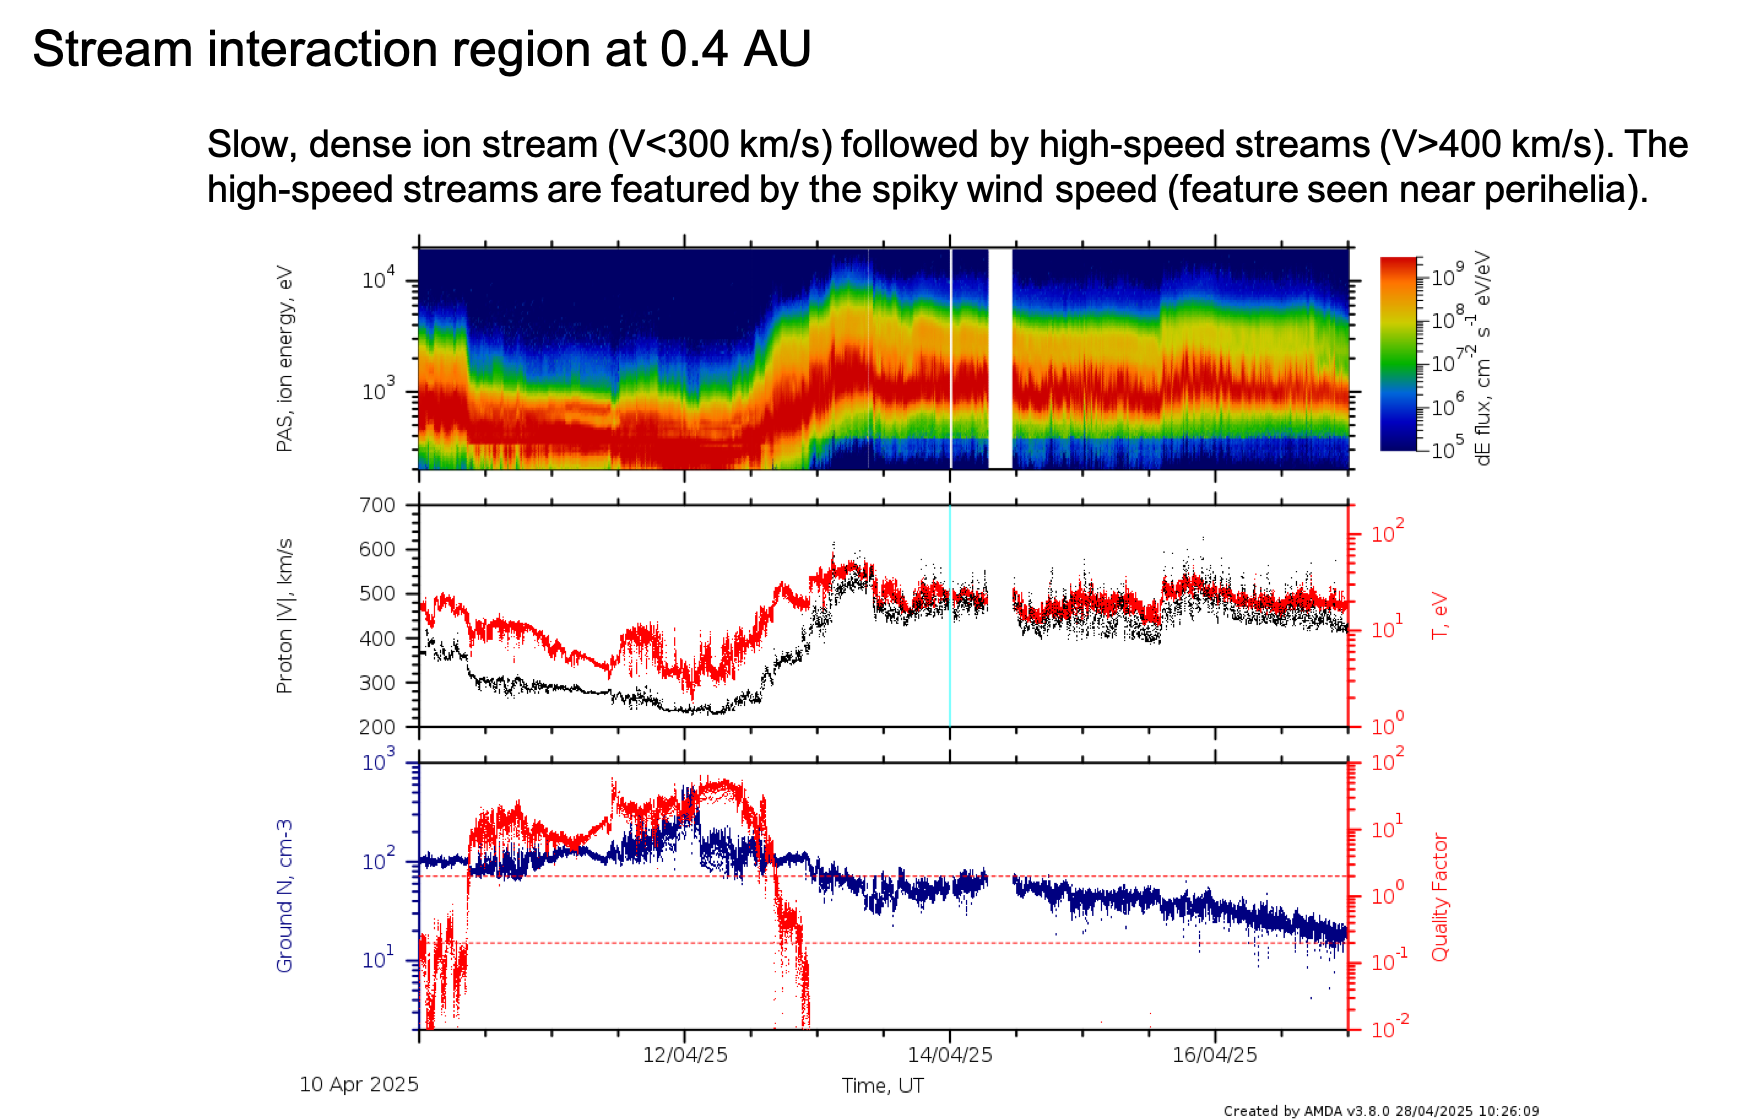
Figure 2. Stream interaction region at 0.4 AU.
Stream interaction region (<0.34 AU) during March 2025 perihelion
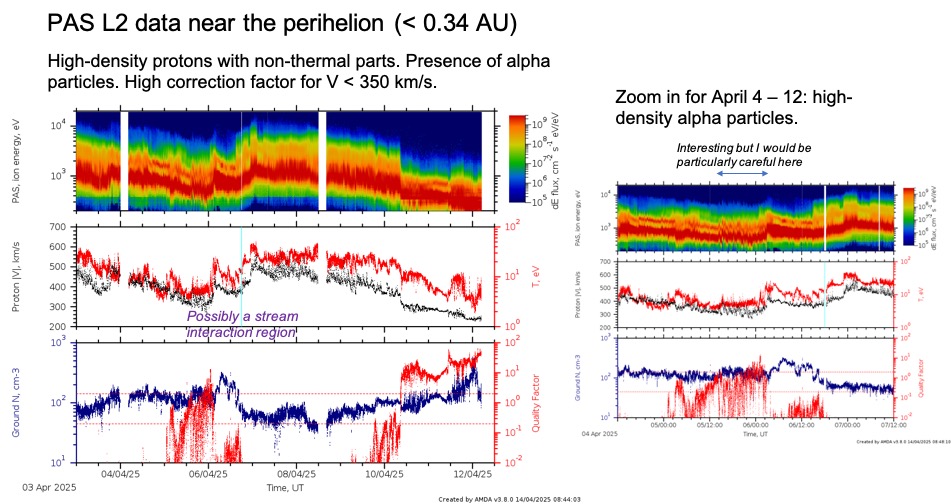
Figure 3. High-density protons. Possibly a stream interaction region.
Fast wind and spiky features during March 2025 perihelion
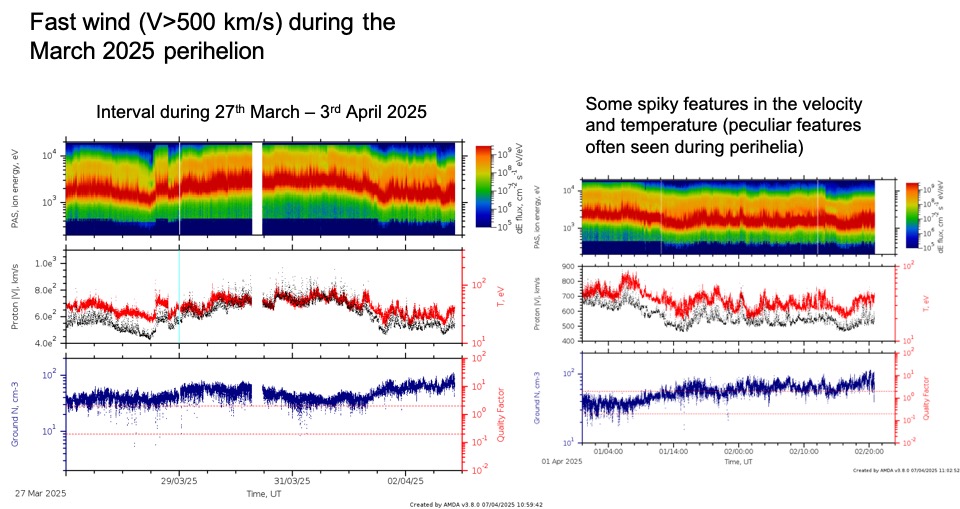
Figure 4. Fast wind and some spiky features near the perihelion (0.29 AU).
Tenuous solar wind on Mar 15, 2025, at 0.4 AU.
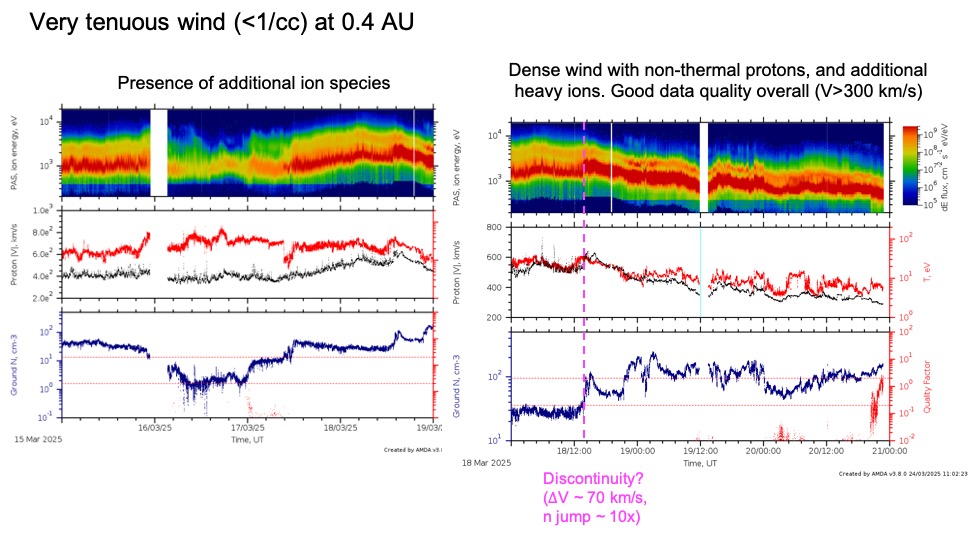
Figure 5. A very tenuous wind (< 1/cc) interval at 0.4 AU.
Shock on Mar 3, 2025.
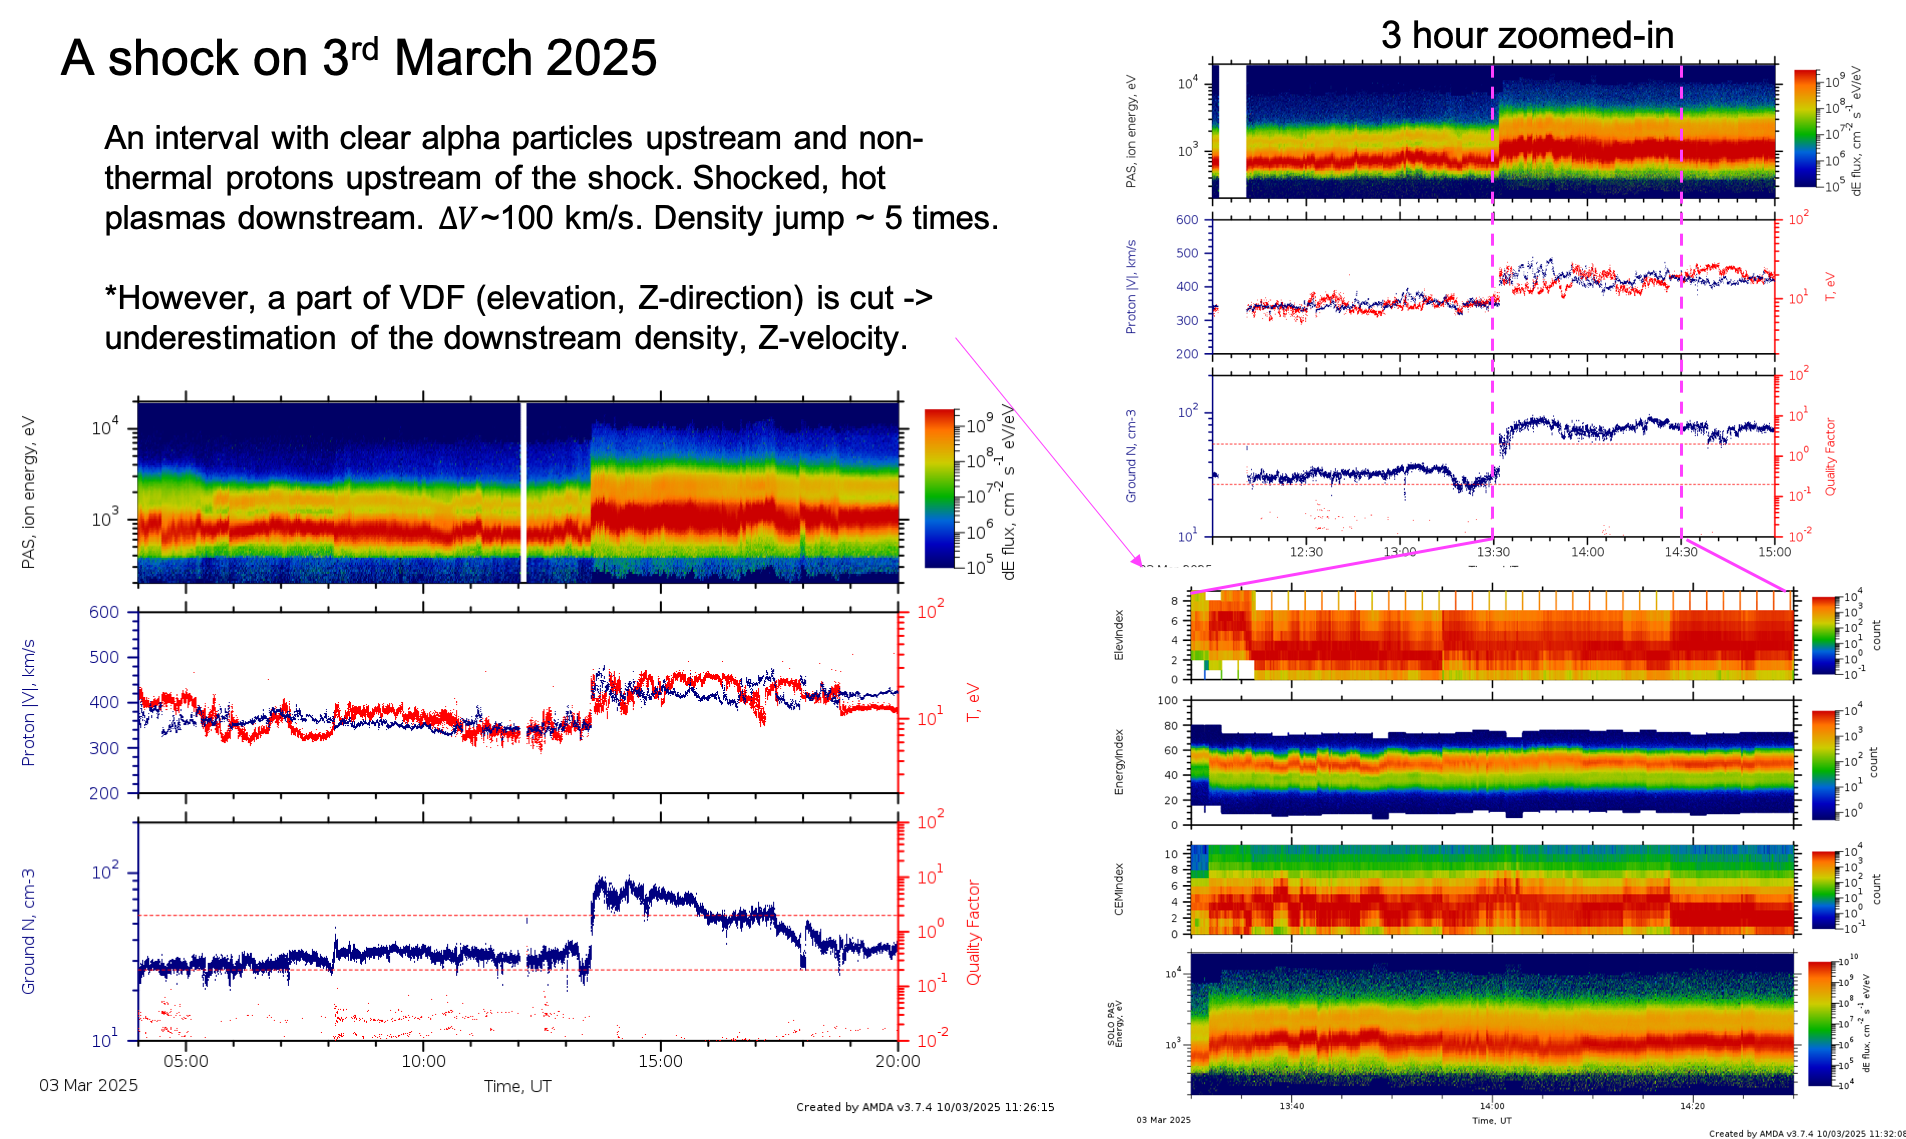
Figure 6. An interplanetary shock with V jump \~ 100 km/s, density jump 5 times.
Multiple events on Feb 23 - Mar 8, 2025.
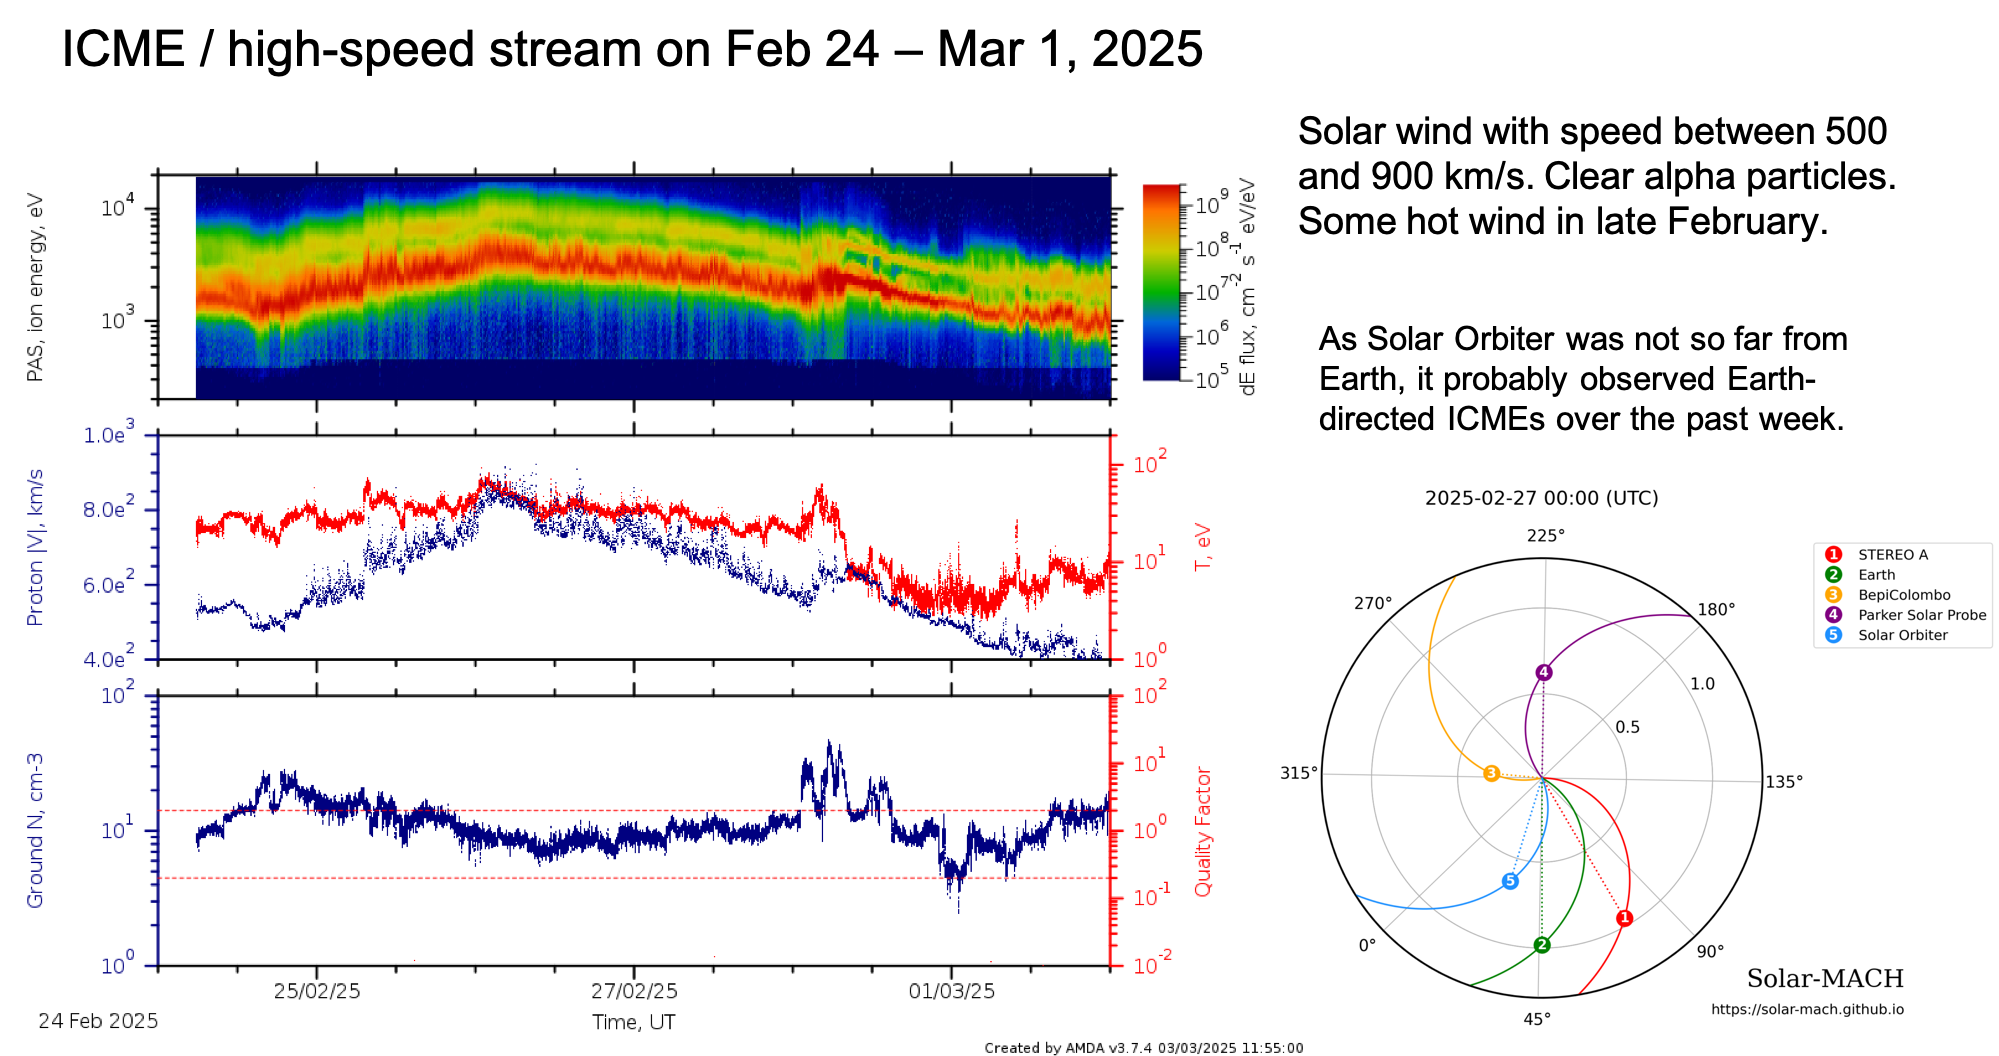
Figure 7. Several interesting structures during STP 350.
ICME / high-speed stream on Feb 24 - Mar 1, 2025.
Figure 8. Earth-directed ICME or high-speed stream.
Shock on Feb 23, 2025.
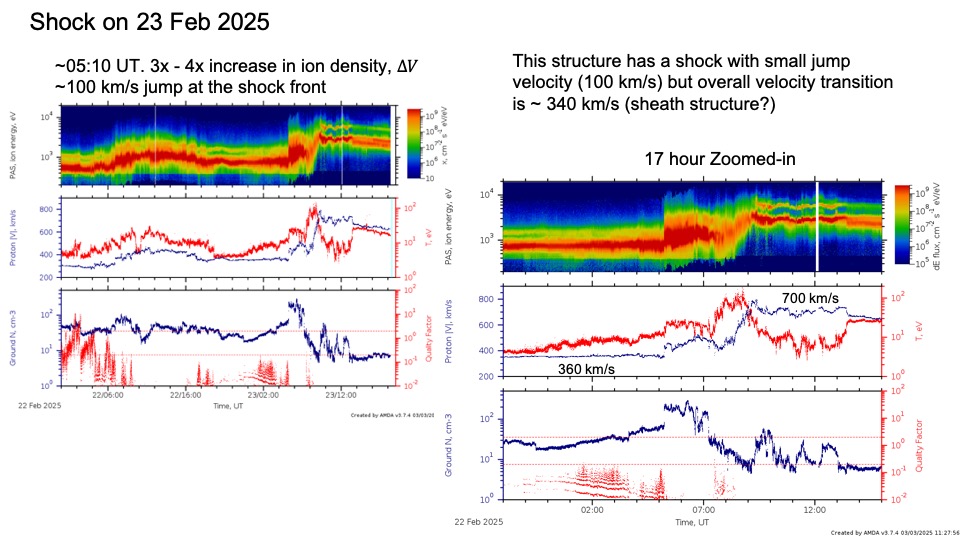
Figure 9. An interplanetary shock captured with PAS 1s mode.
Magnetic cloud-like structure and stream interface on Feb 4 - 9, 2025.
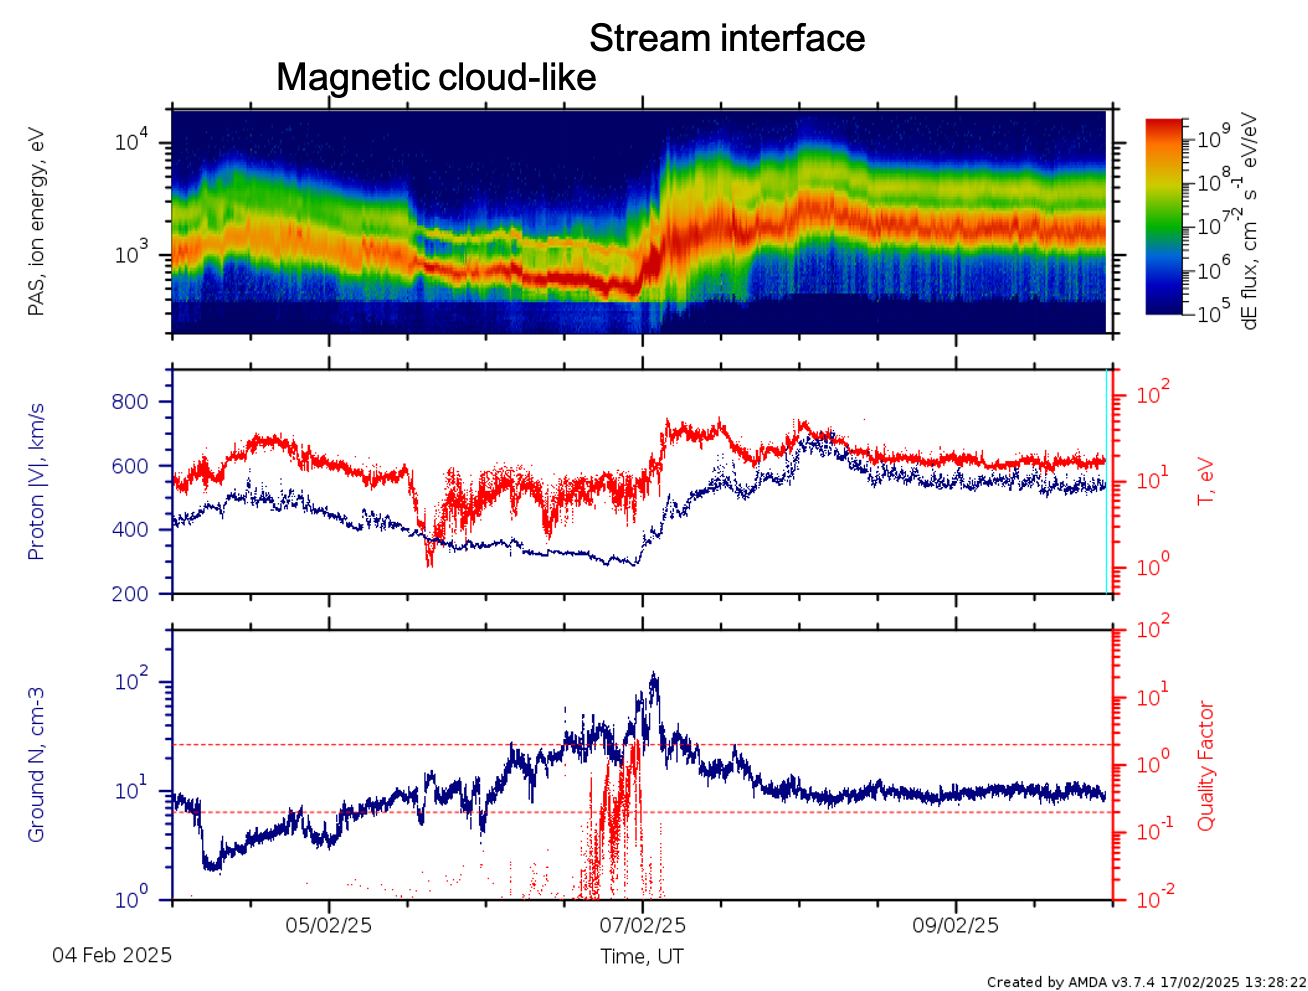
Figure 10. Magnetic cloud-like structure followed by a stream interface .
Shock on Feb 1, 2025.
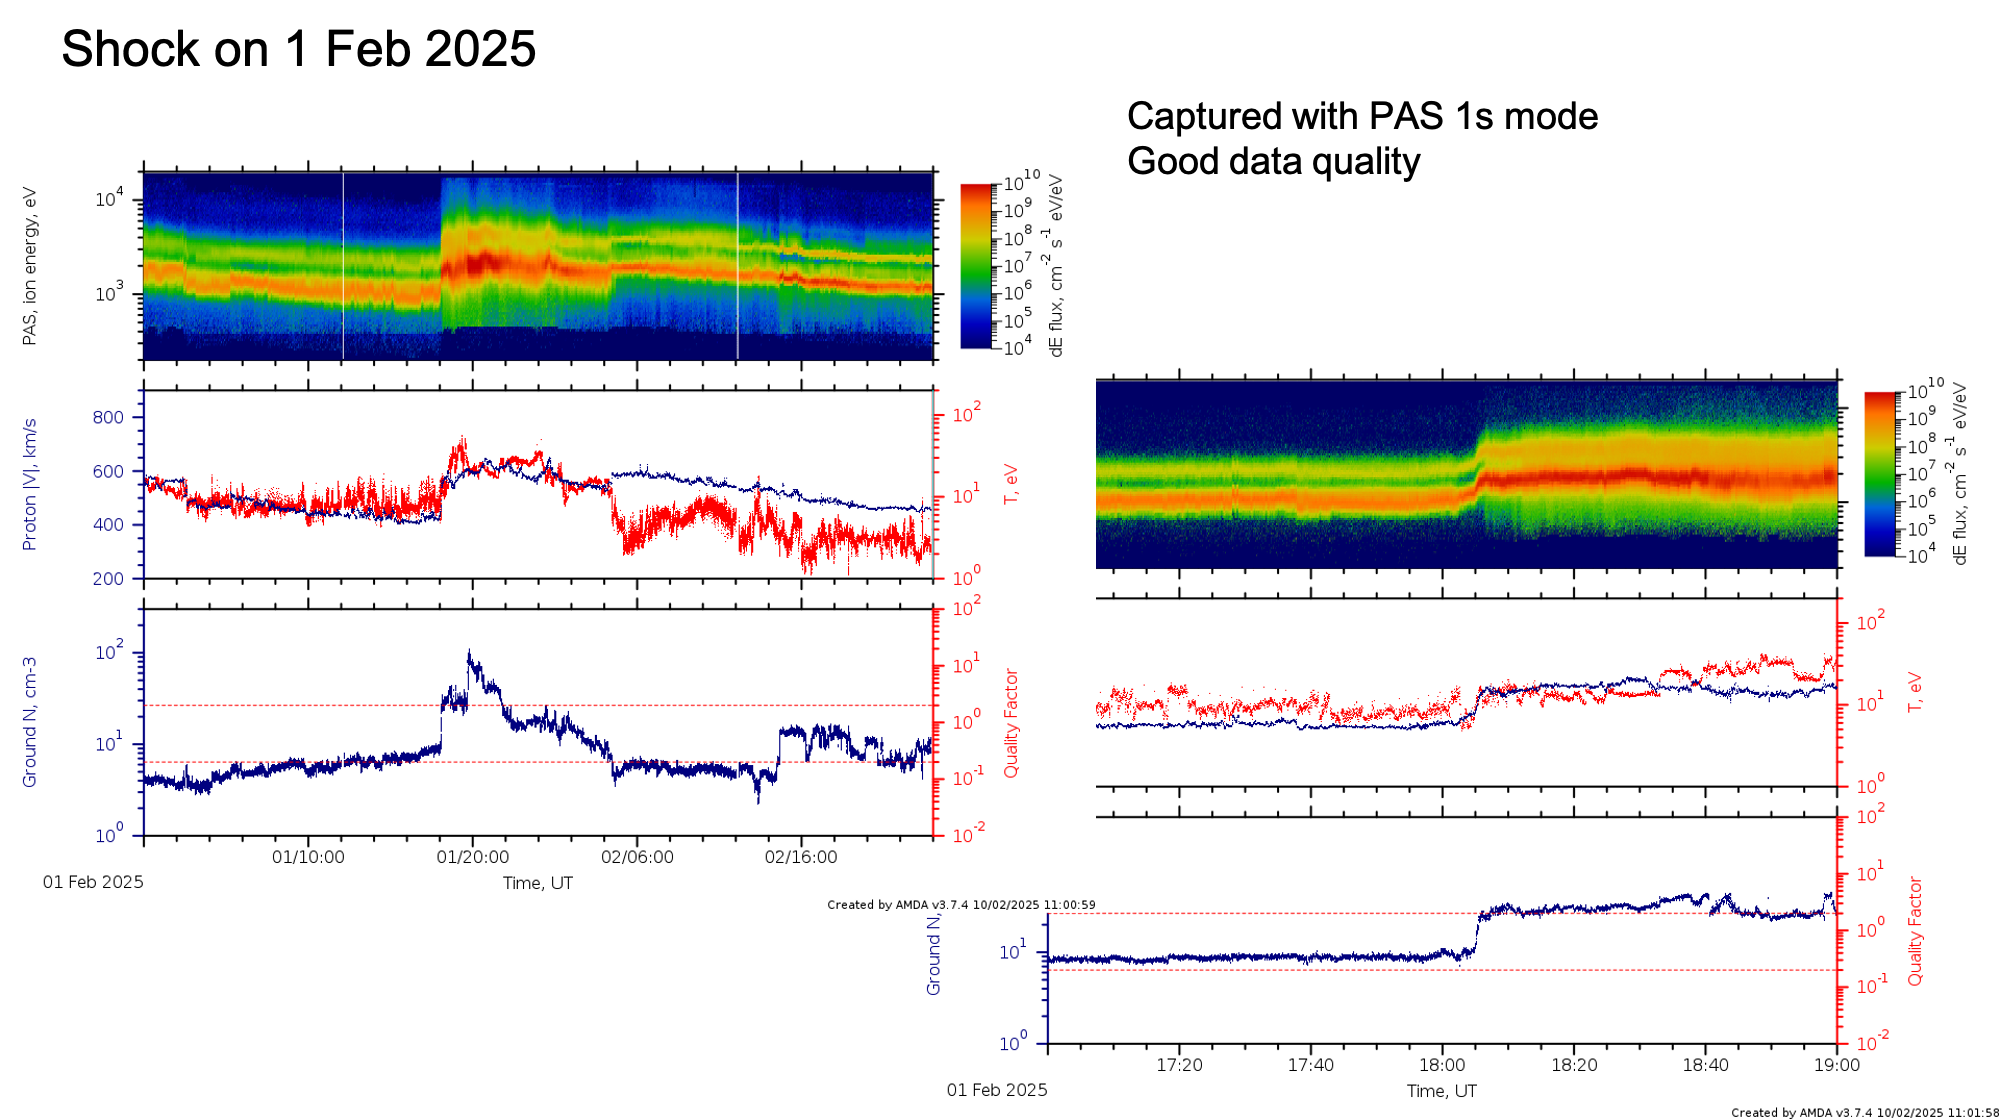
Figure 11. An interplanetary shock captured with PAS 1s mode.
High-speed stream, shock, ICME on Jan 28 - Feb 8, 2025.
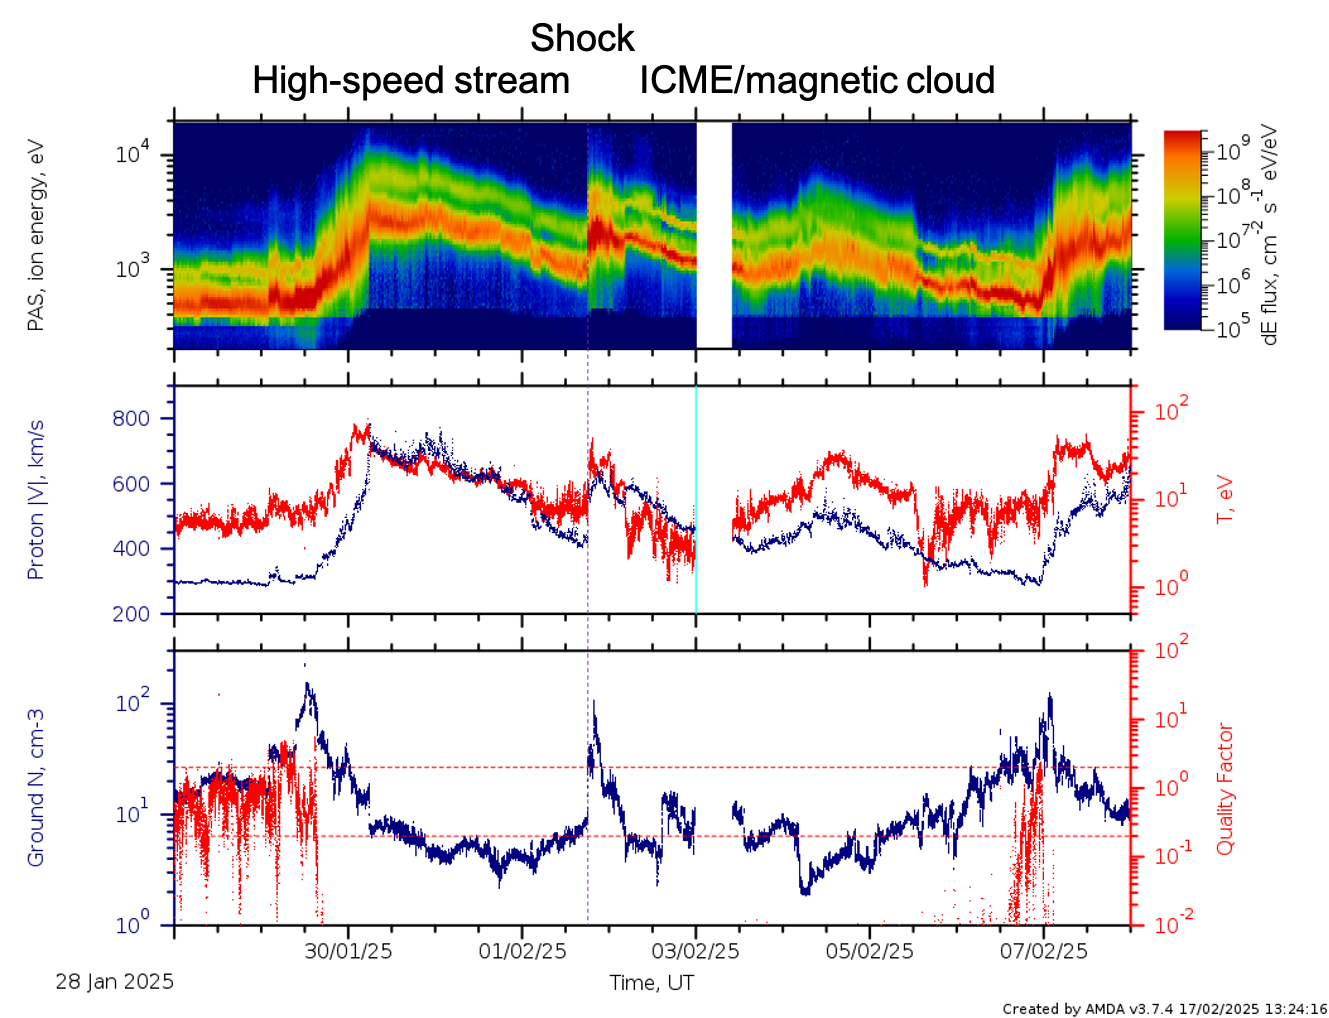
Figure 12. High-speed stream, shock, ICME on Jan 28 - Feb 8, 2025.
ICME on 31 Dec 2024 – 3 Jan 2025
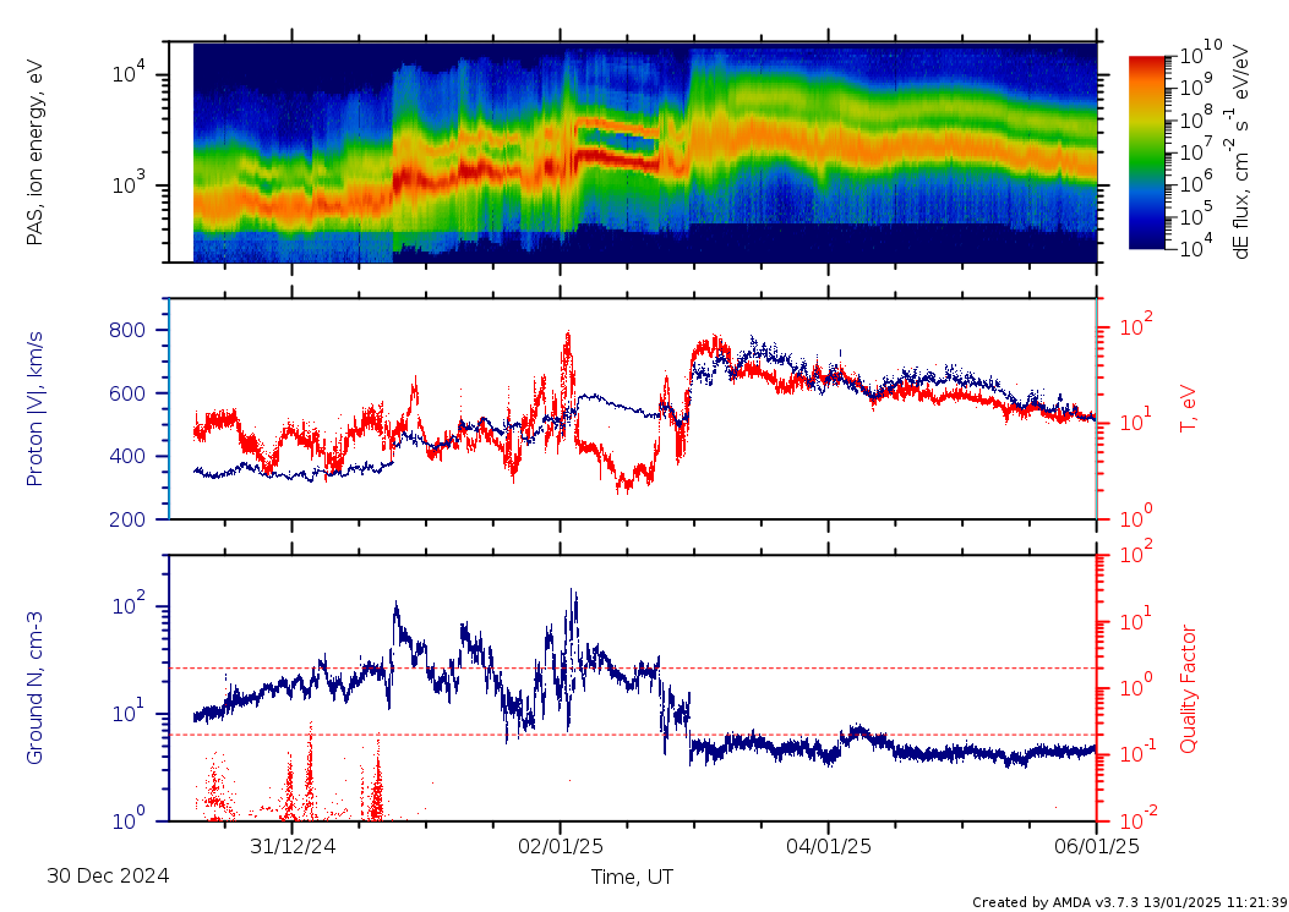
Figure 13. Earth-directed ICME, aurorae seen with Kp 4 – 8, clear magnetic cloud with cold protons and alphas and with heavier ions. High-speed hot wind after the magnetic cloud.
A few stream interfaces on Dec 7 - 14, 2024
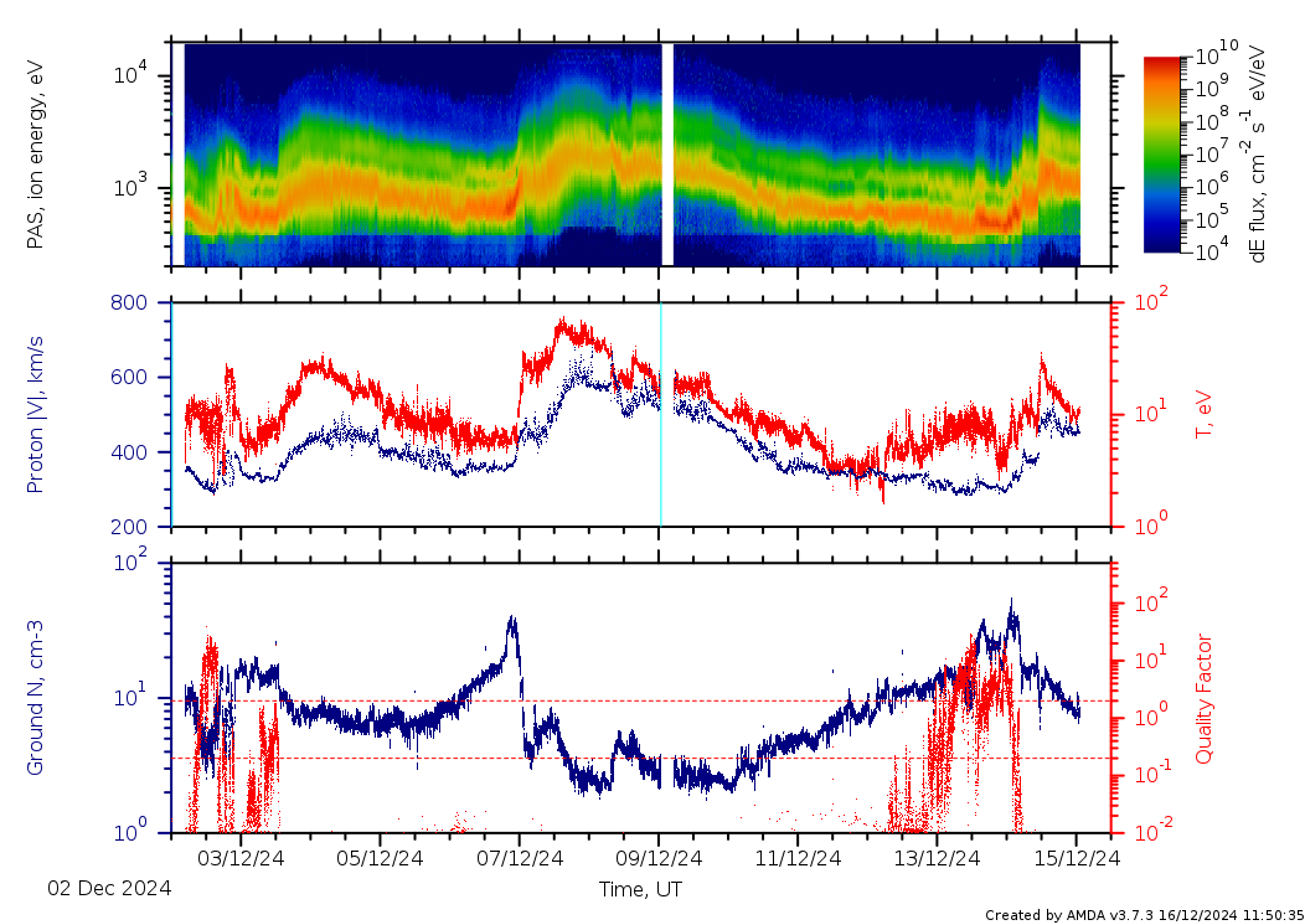
Figure 14. Interface between slow and fast streams on Dec 7th, and perhaps also on Dec 3rd and14th.
Interval with clear presence of alphas on Nov 25, 2024
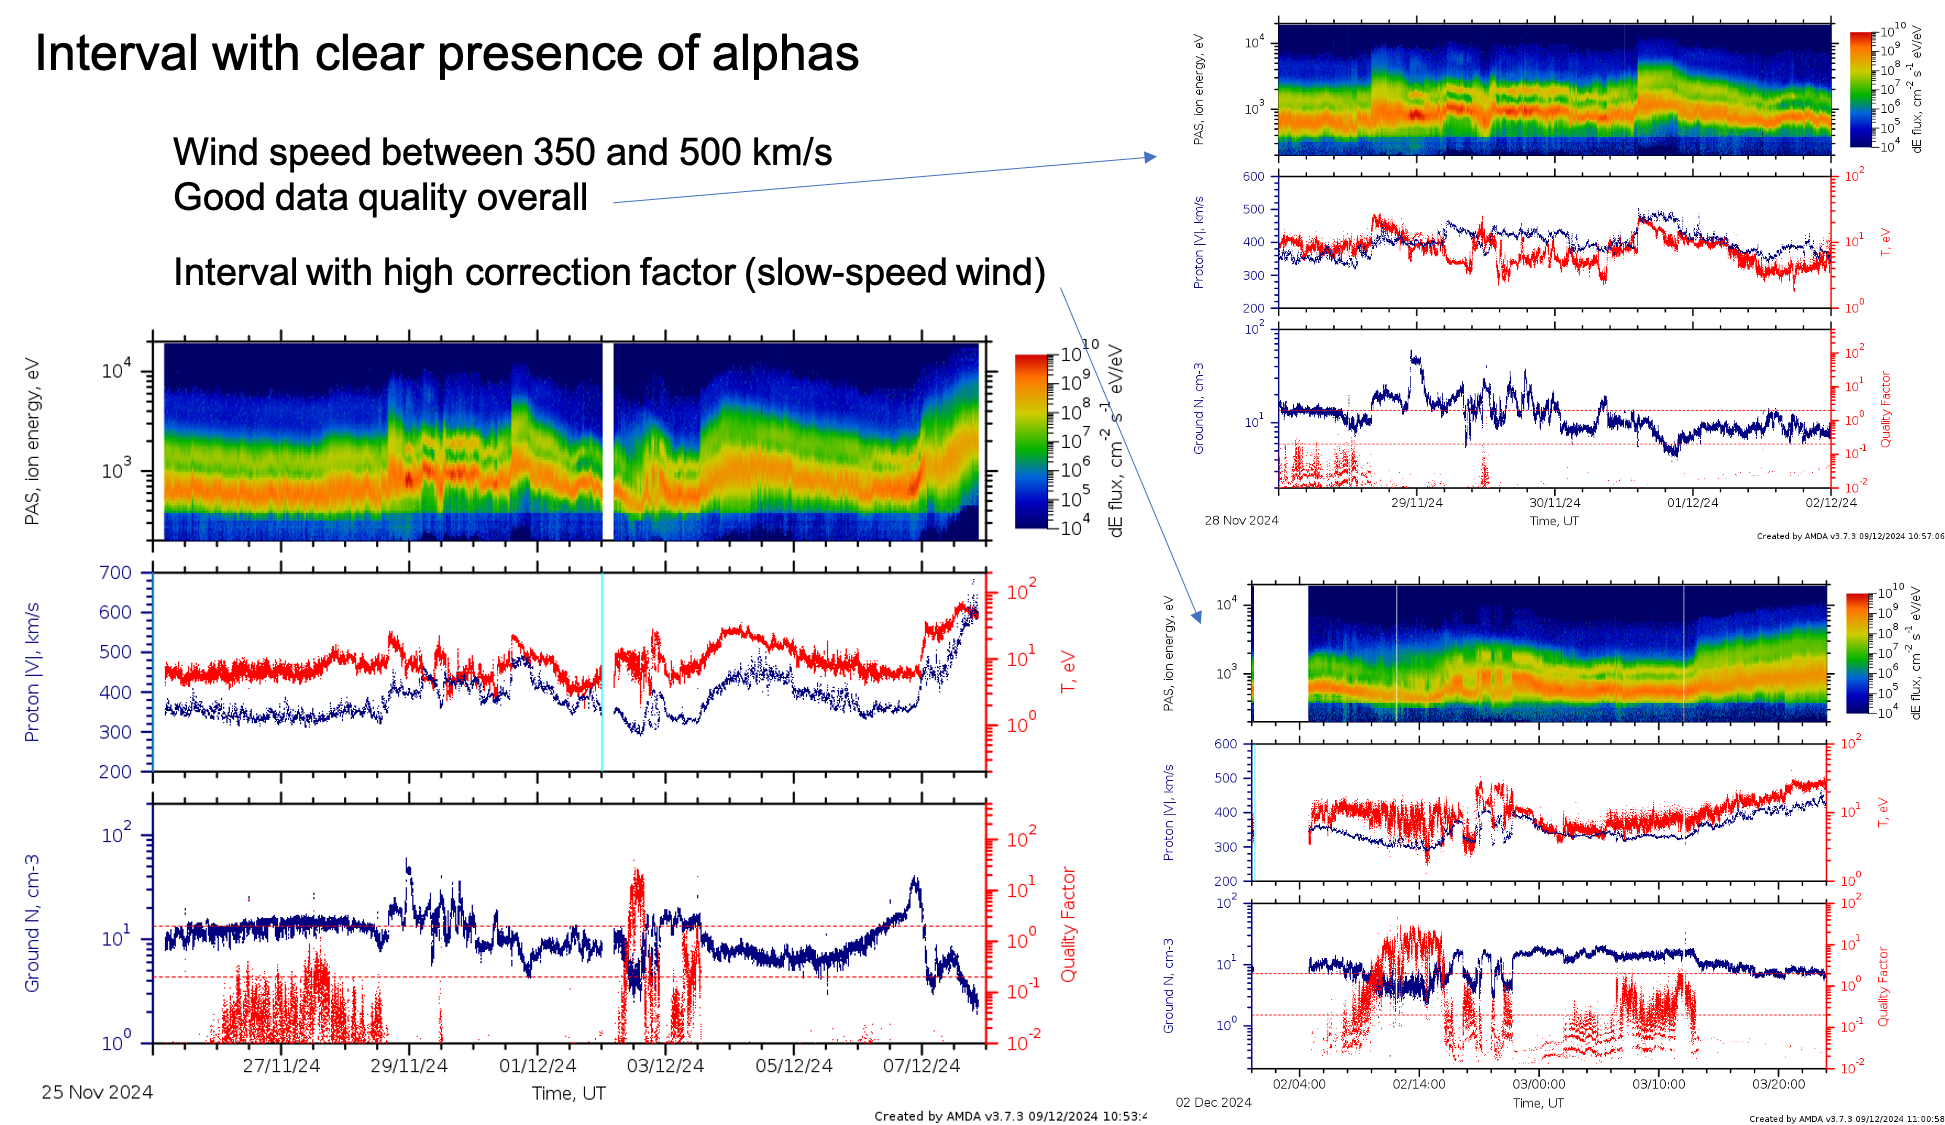
Figure 15. Interval with clear presence of alphas.
Stream interaction region on Nov 16, 2024
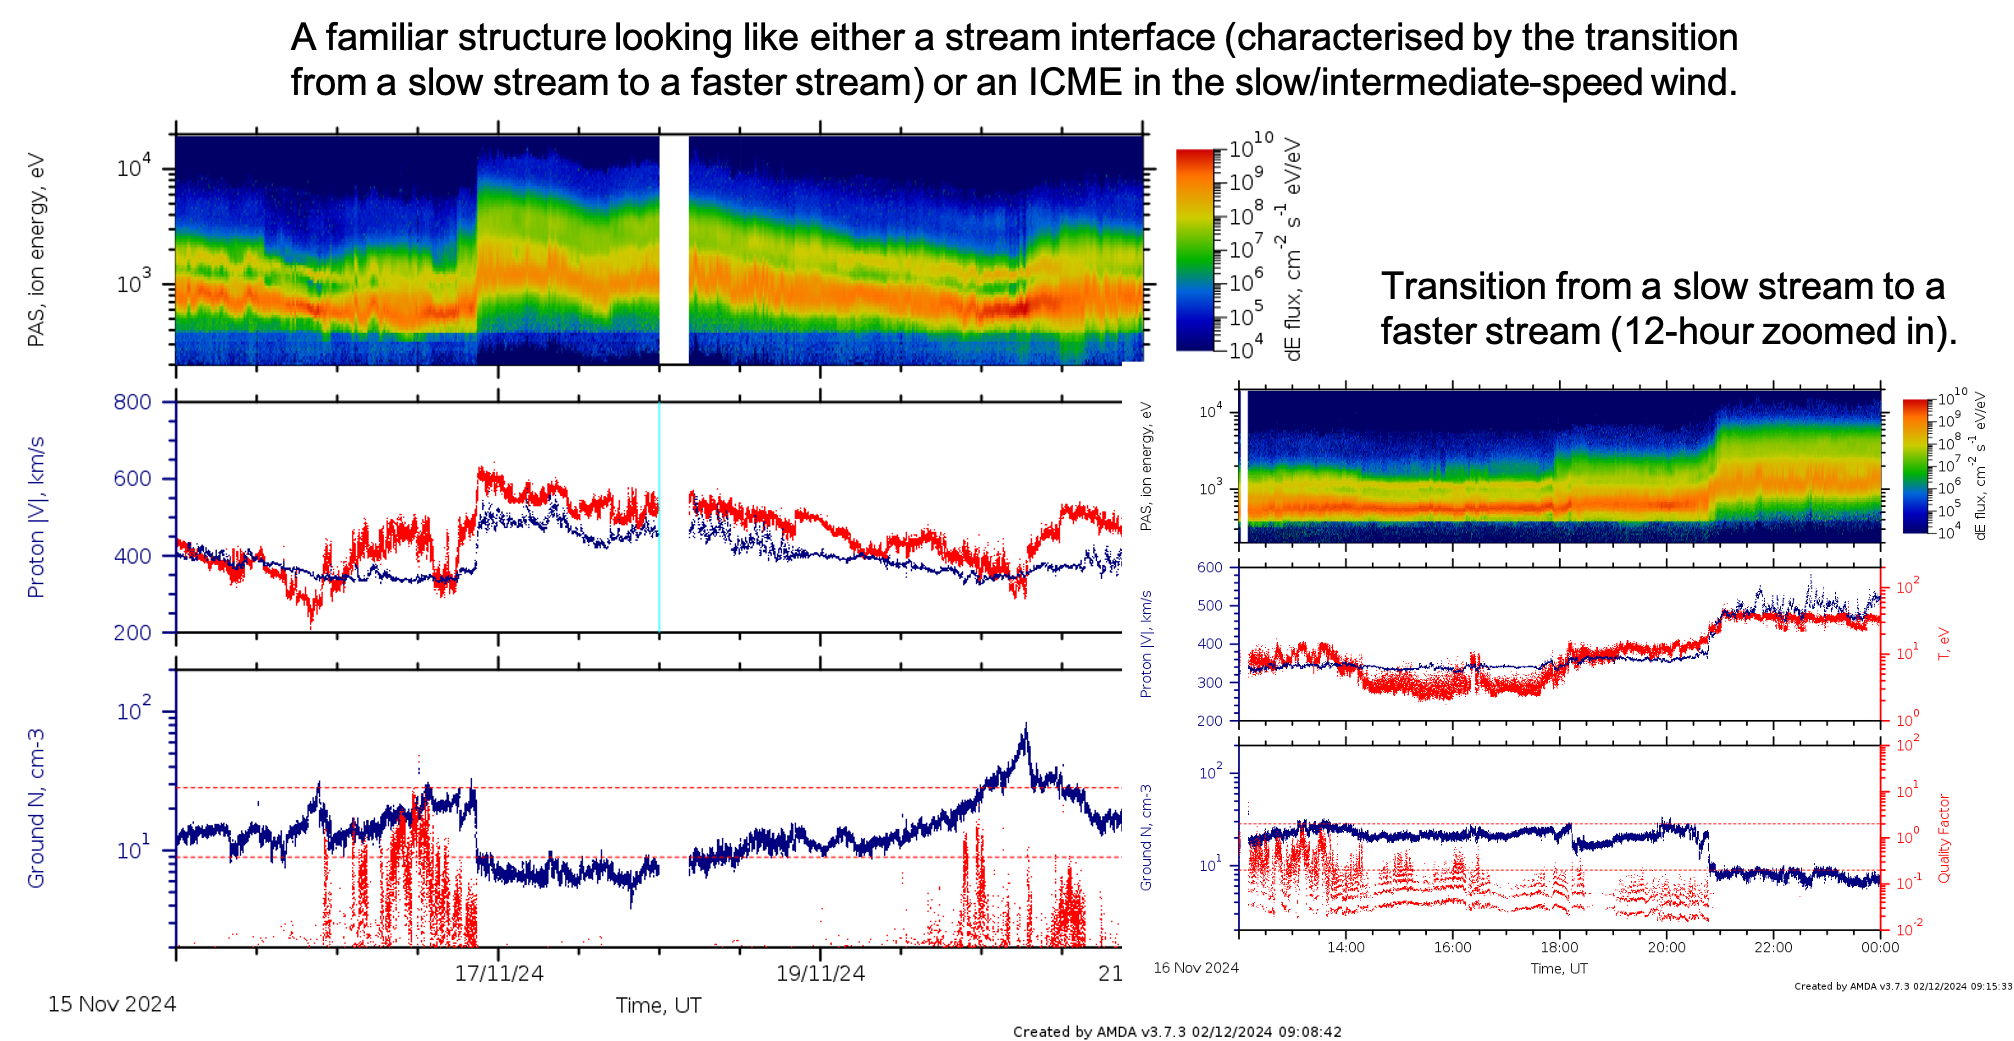
Figure 16. A familiar structure looking like either a stream interface or an ICME in the slow/intermediate-speed wind.
Stream interaction region on Nov 12, 2024
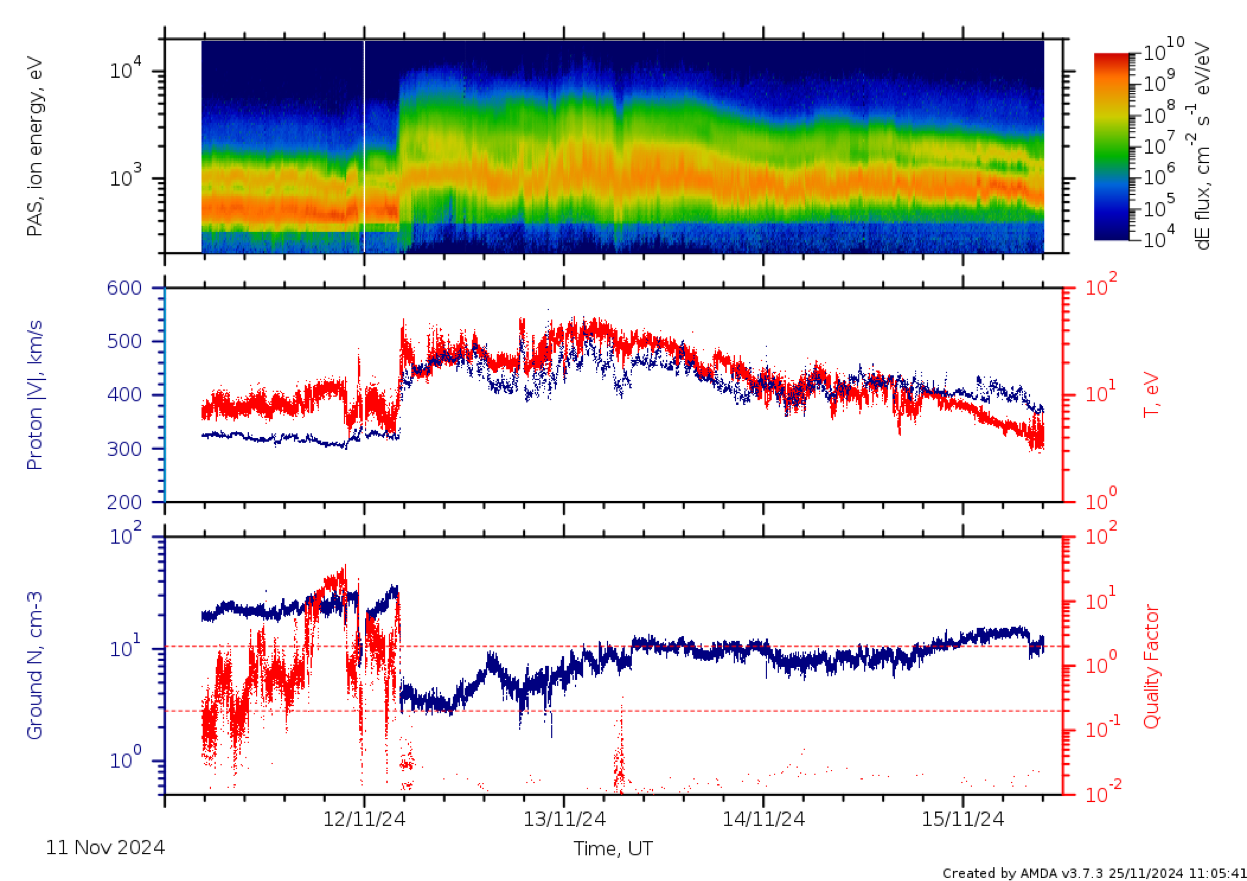
Figure 17. Stream interaction region with non-thermal protons and alpha particles especially in the fast wind. Significant data correction for the slow wind that preceded the stream interface.
IP Shock in slow wind on Nov 6, 2024
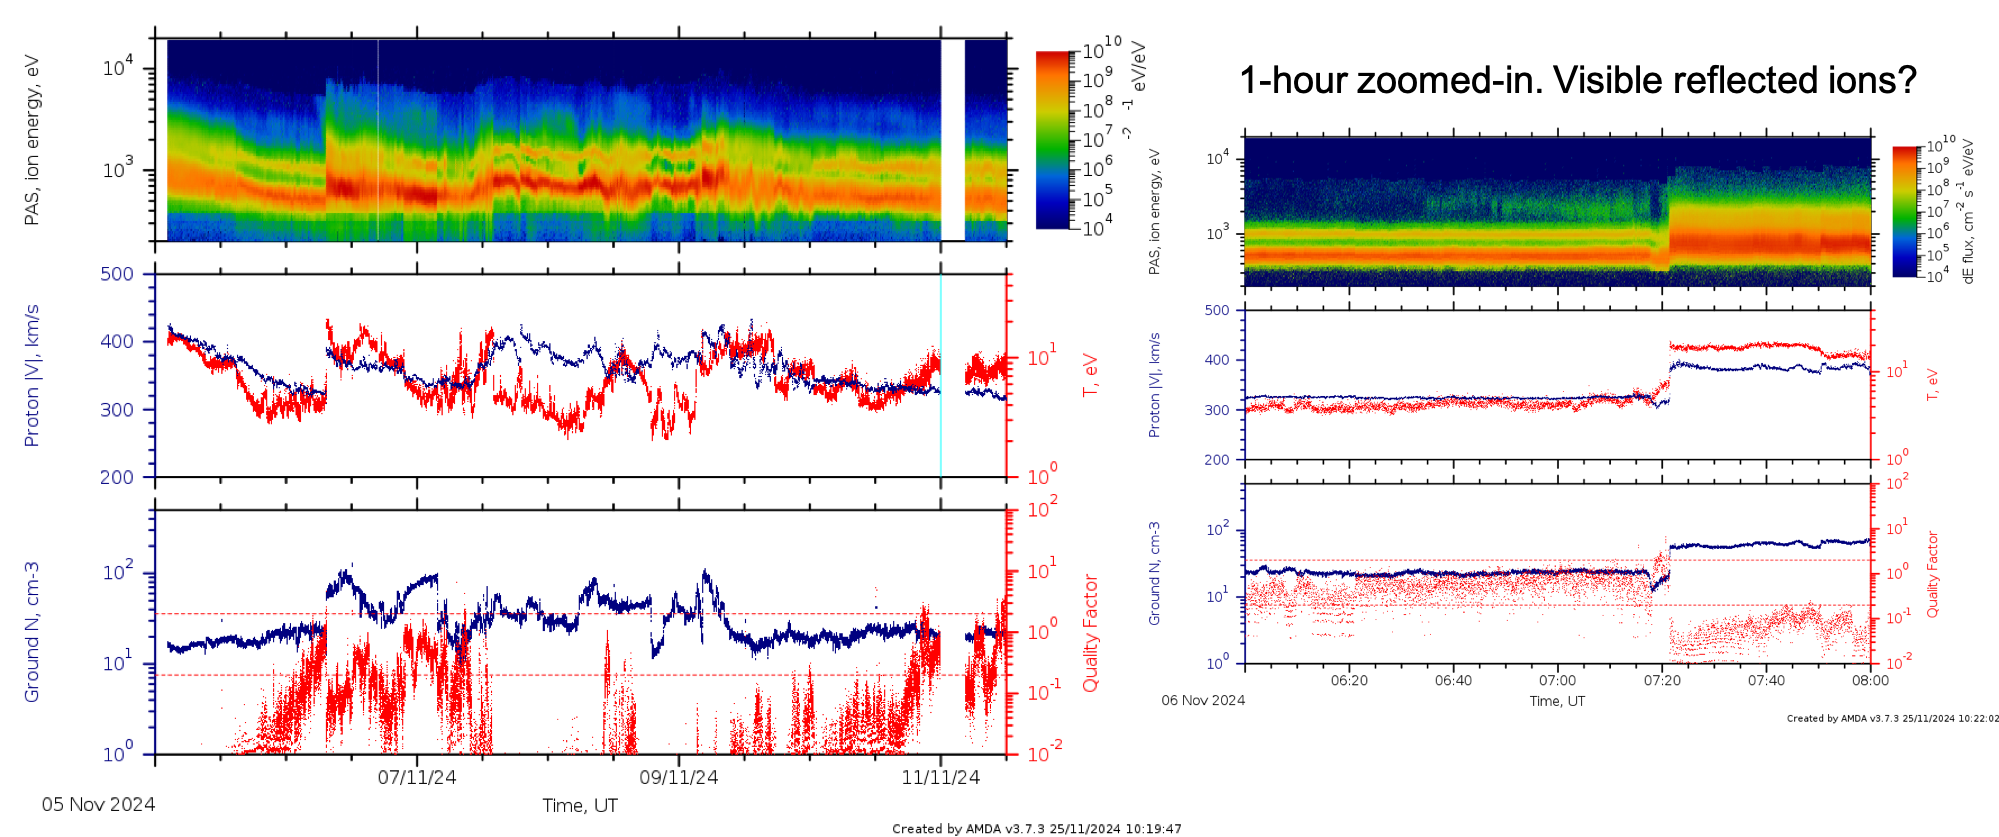
Figure 18. Interplanetary shock with V jump of 60 km.s^-1 (Ratio Nd to Nu is about 2). Clear alpha particles. Non-thermal proton intervals.
High-speed stream on October 27, 2024
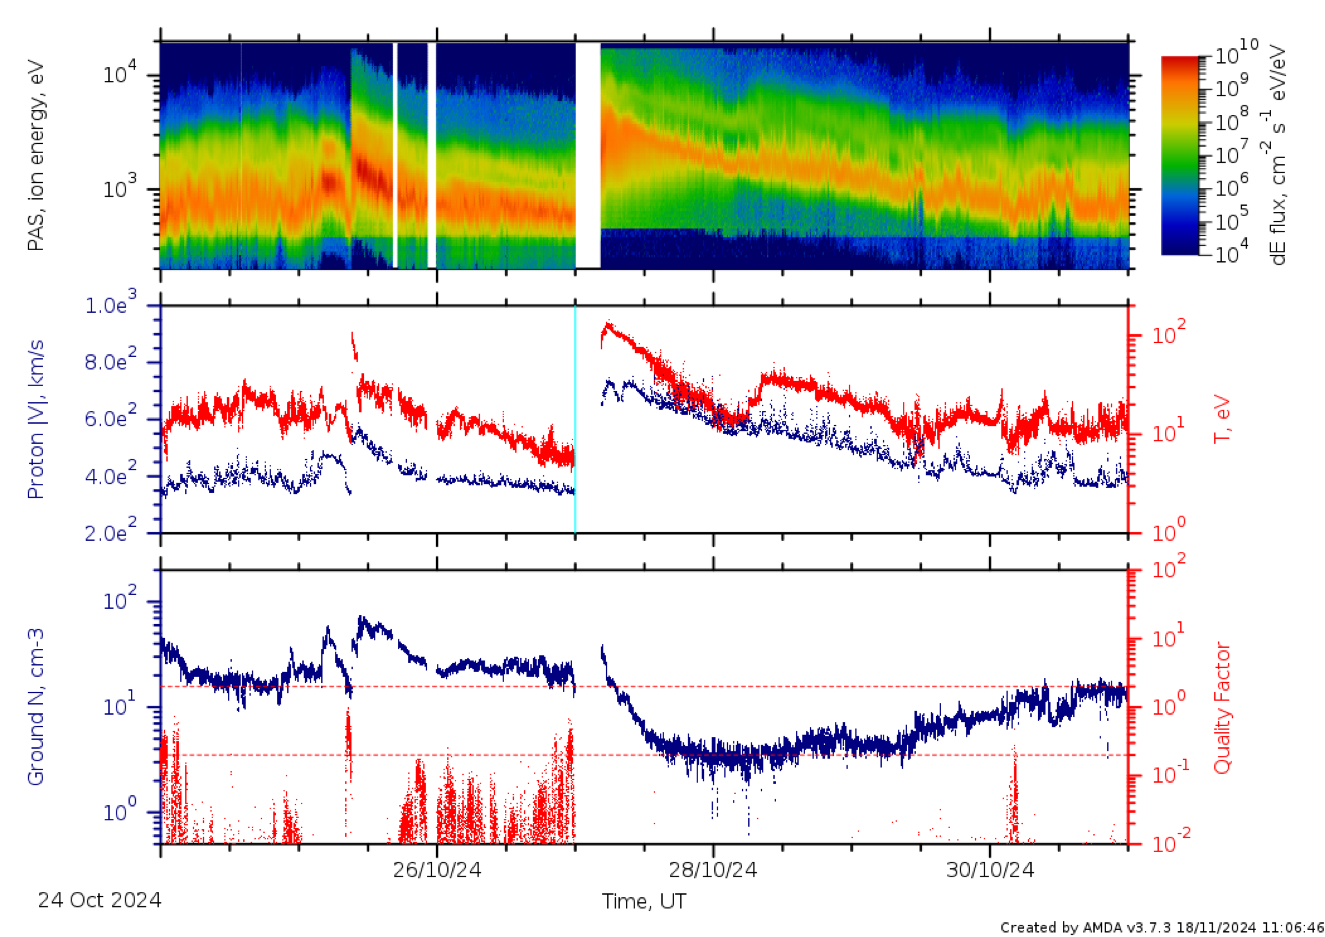
Figure 19. Interesting interval with high-speed stream on October 27, 2024. Missed data context during WOL at the beginning of STP 332. Clear non-thermal ion intervals. Data quality is mostly good.
Slow ICME-like structure on October 13, 2024
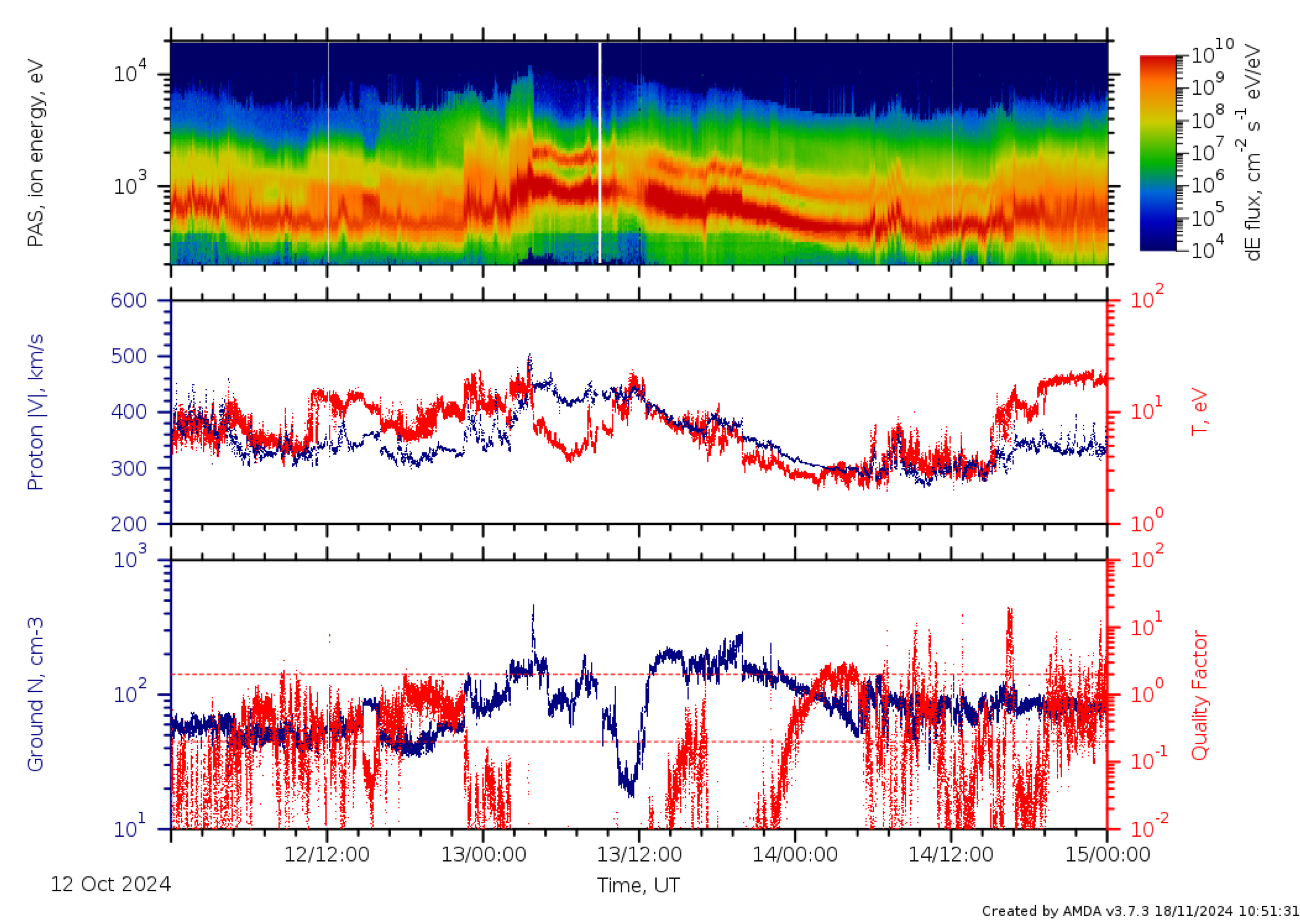
Figure 20. ICME in slow wind. Max proton speed ~ 420 km/s. Clear alpha particle flux. High correction factor due to low proton speed surrounding the structure.
Overview of October 2024 perihelion
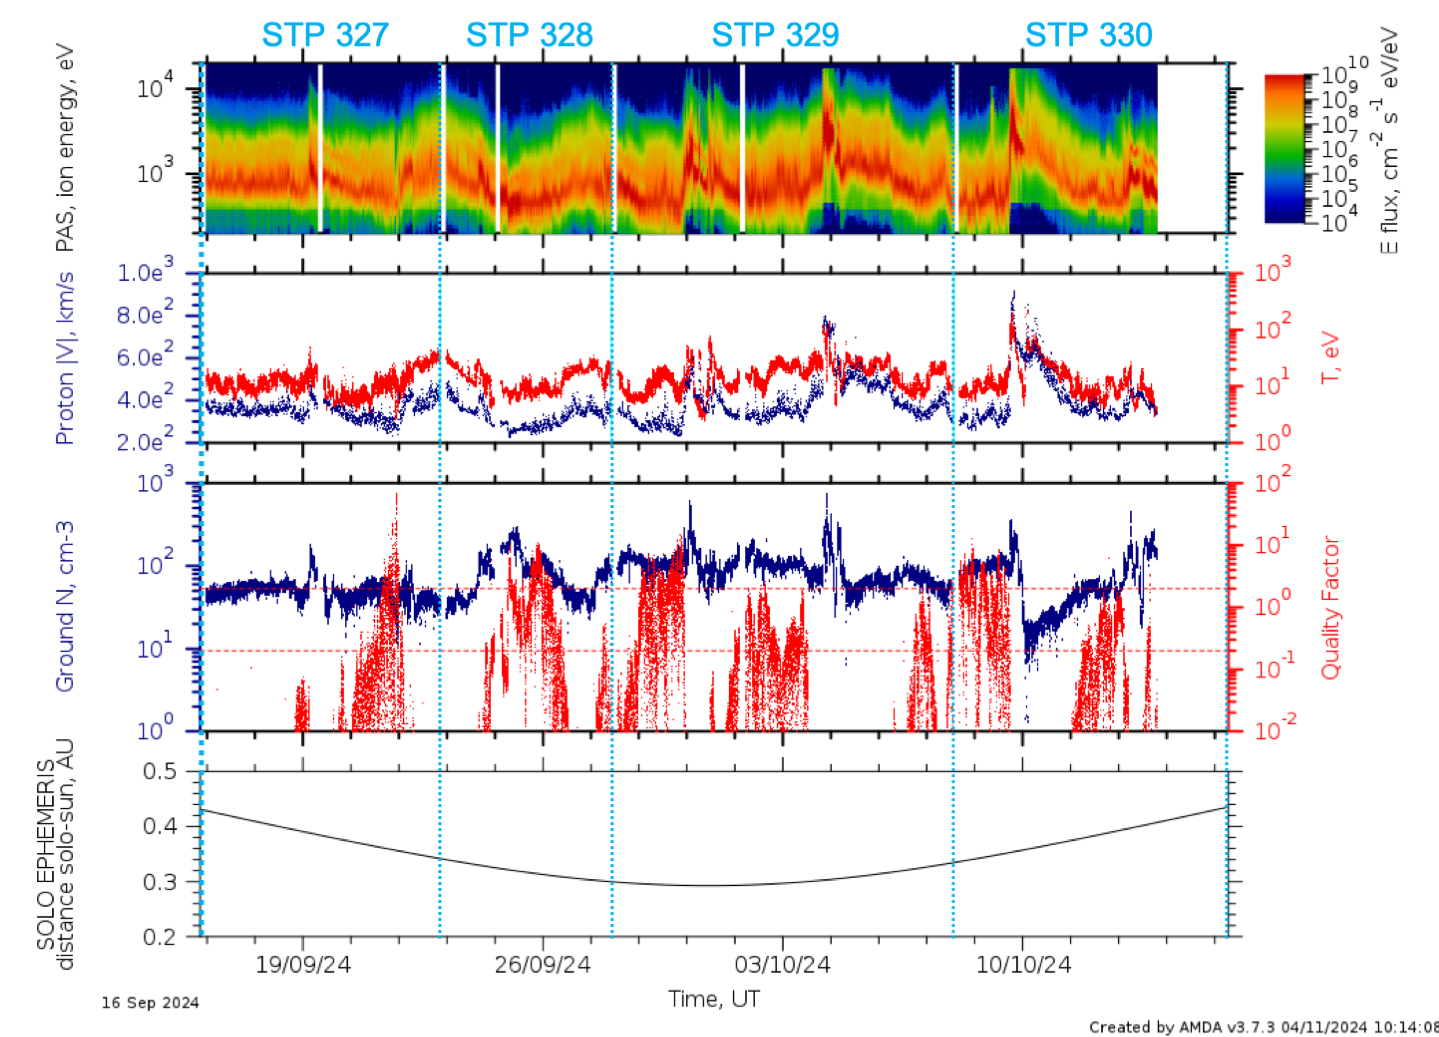
Figure 21. PAS 1s mode except for Sep 23 – 25 in STP 328, where PAS was on 2s mode (see operation table). High correction factor (lower data quality) for slow wind streams. High solar activities with several ICMEs detected. PSP was also in the vicinity of SO during this perihelion.
Shock, ICME on 9 - 10 October 2024
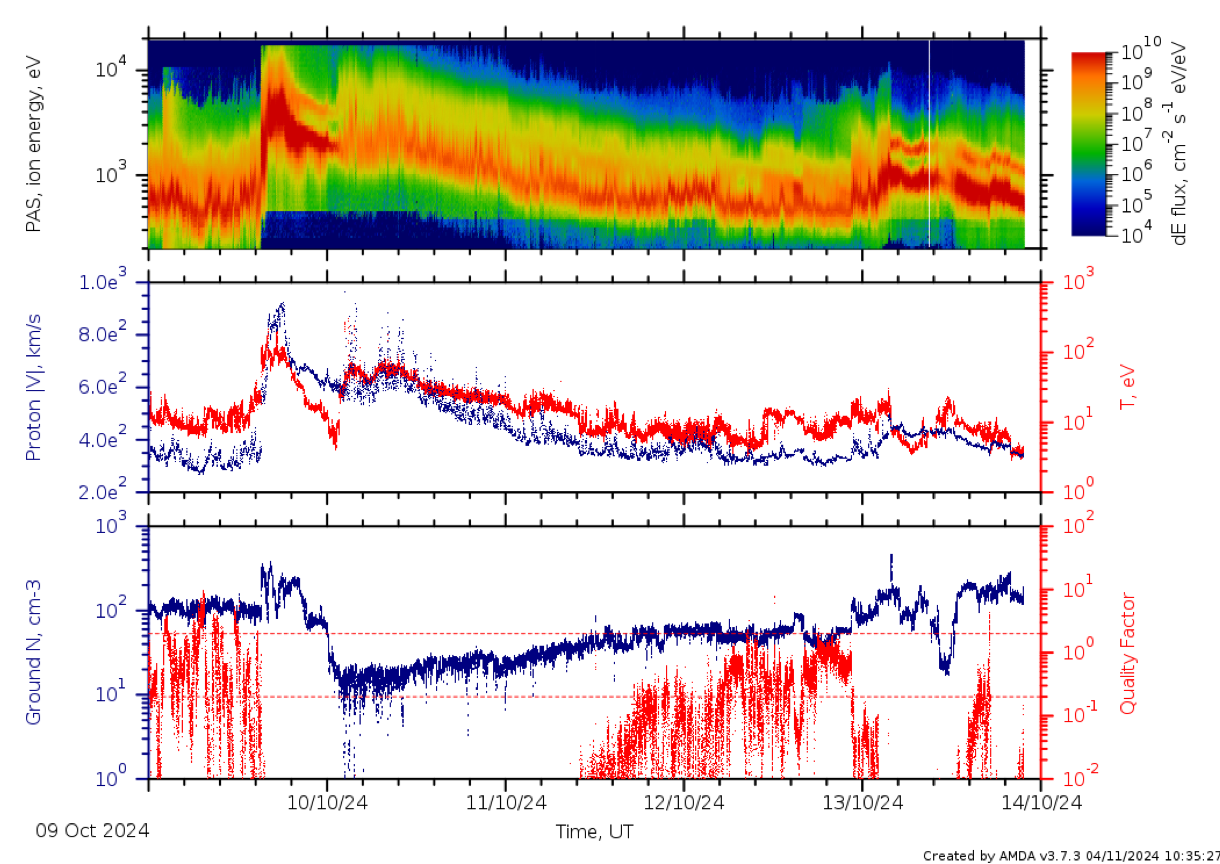
Figure 22. An ICME-like structure. PAS 1s data. Good data quality throughout apart from the slow wind. Velocity jump > 400 km/s. Hot and dense ion stream (sheath) behind the velocity jump. The jump contains two-step-like shocks. Interesting non-thermal proton and alpha interval.
Shock 4 October 2024
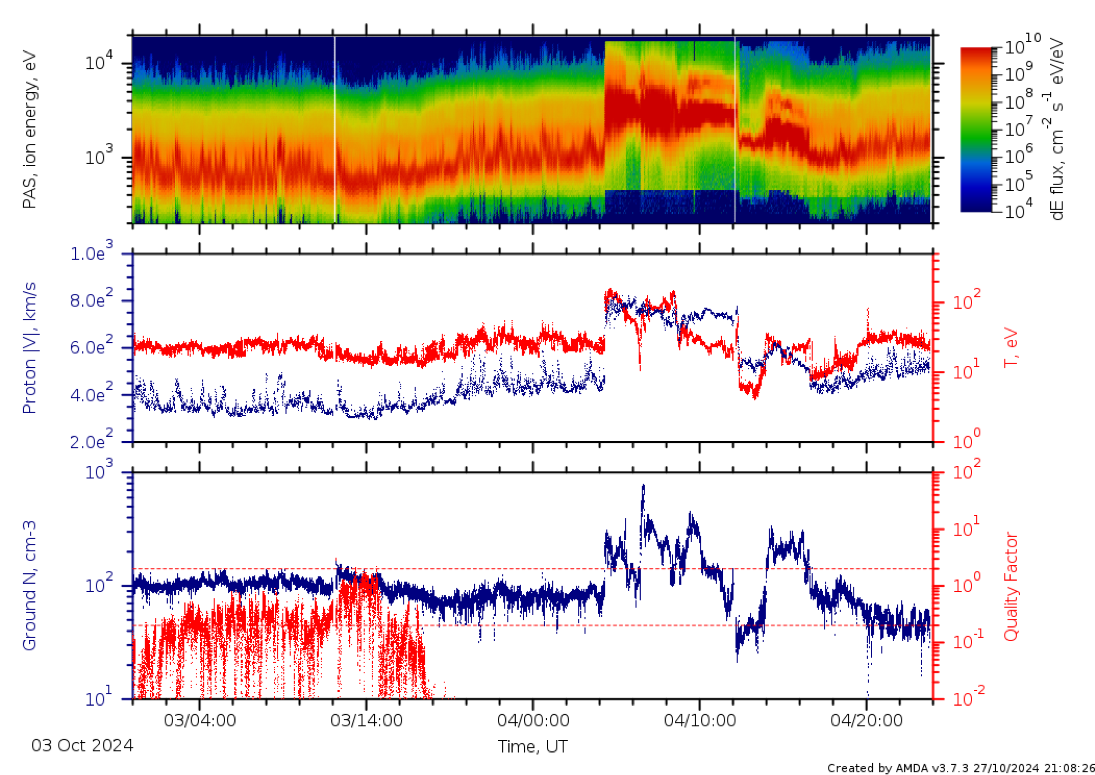
Figure 23. A shock at the perihelion (0.3 AU). PAS 1s data. Good data quality throughout apart from the slow wind. A shock with \Delta 𝑉 400 km/s with a very dense interval behind the shock (sheath?).
Interesting structure at the perihelion on Sep 29 – Oct 2, 2024
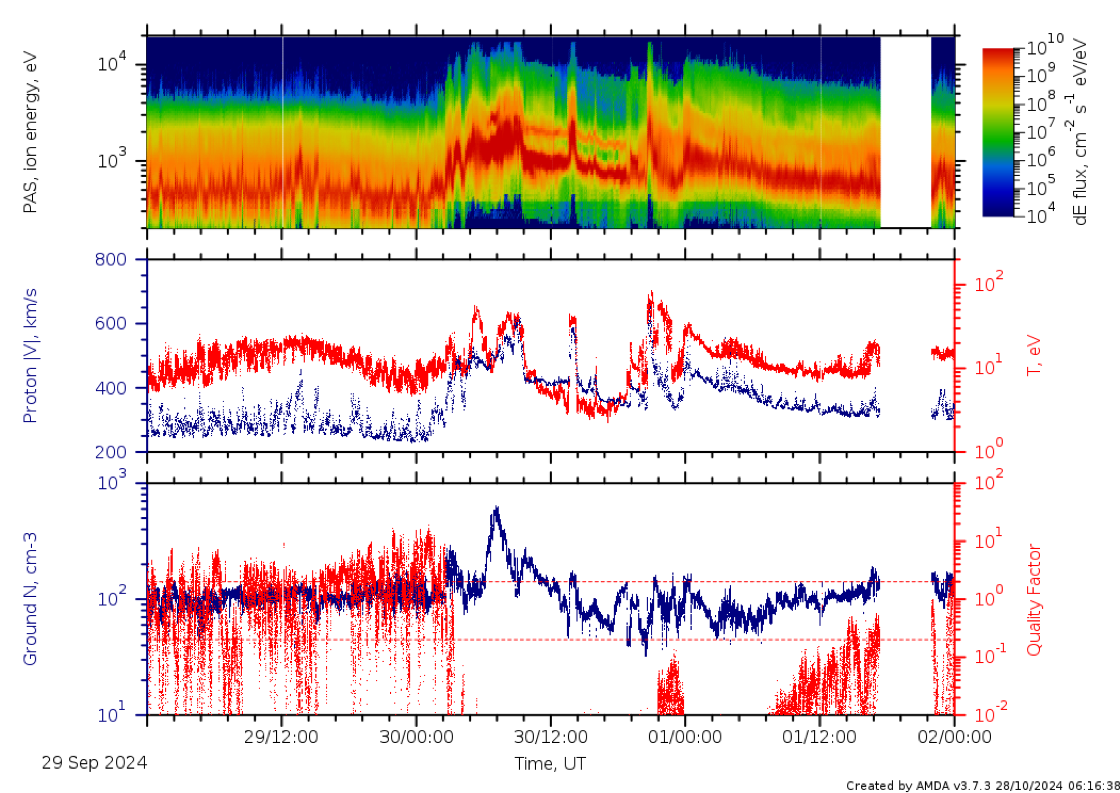
Figure 24. Interesting structure at the perihelion (0.3 AU). PAS 1s data. Good data quality throughout apart from the slow wind. Either a stream interface (transition from slow- to high-speed stream) or an ICME with cold materials containing clear alpha particles. Featured by spiky structures (time scale of hours).
Data near Oct 2024 perihelion (0.3 AU)
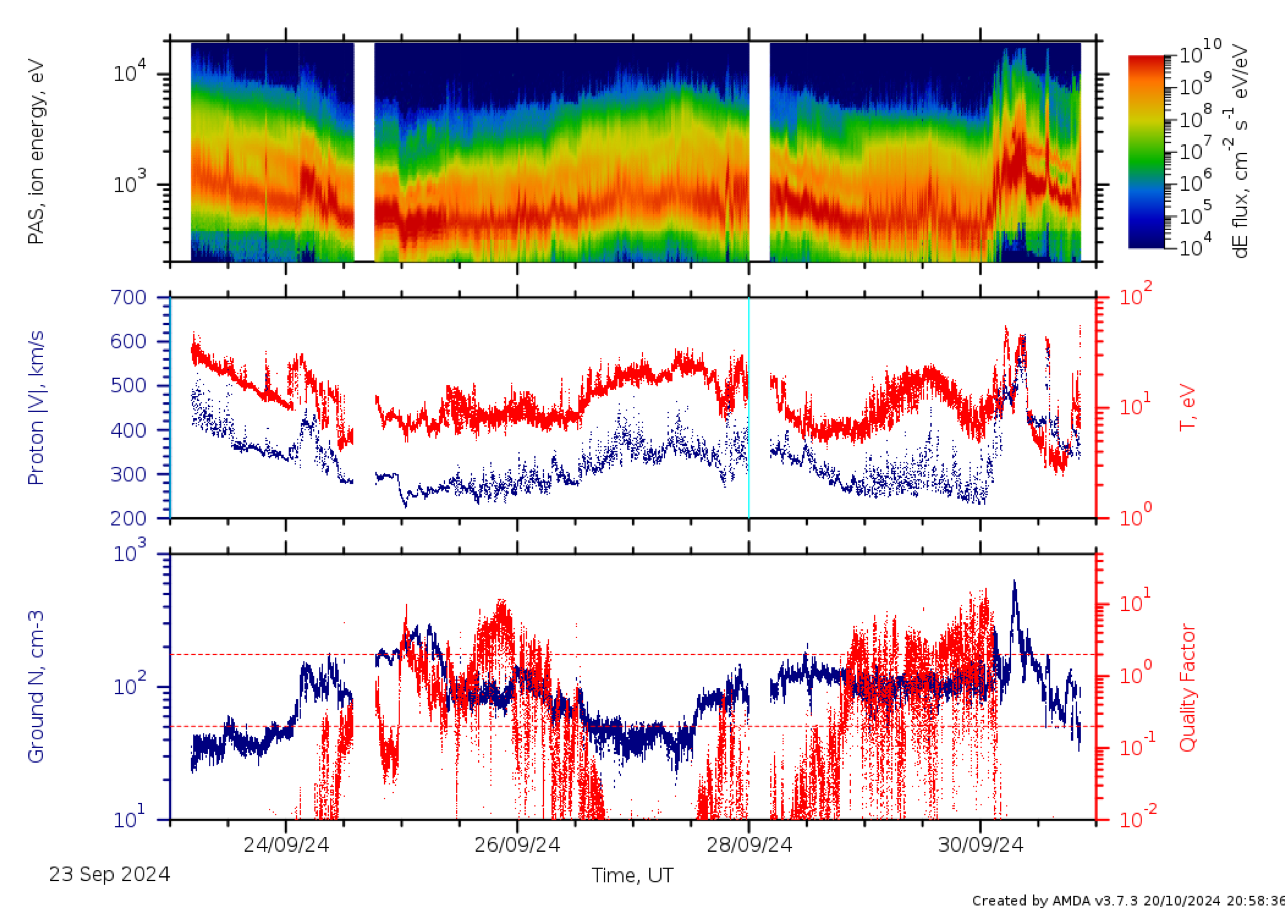
Figure 25. Slow, dense, and hot solar wind featured by spiky features (~ timescale of hours) in energy, velocity, temperature. A transition to intermediate/high-speed stream after Sep 30th.
Intermediate-speed wind with spiky features near Oct perihelion (0.3 AU)
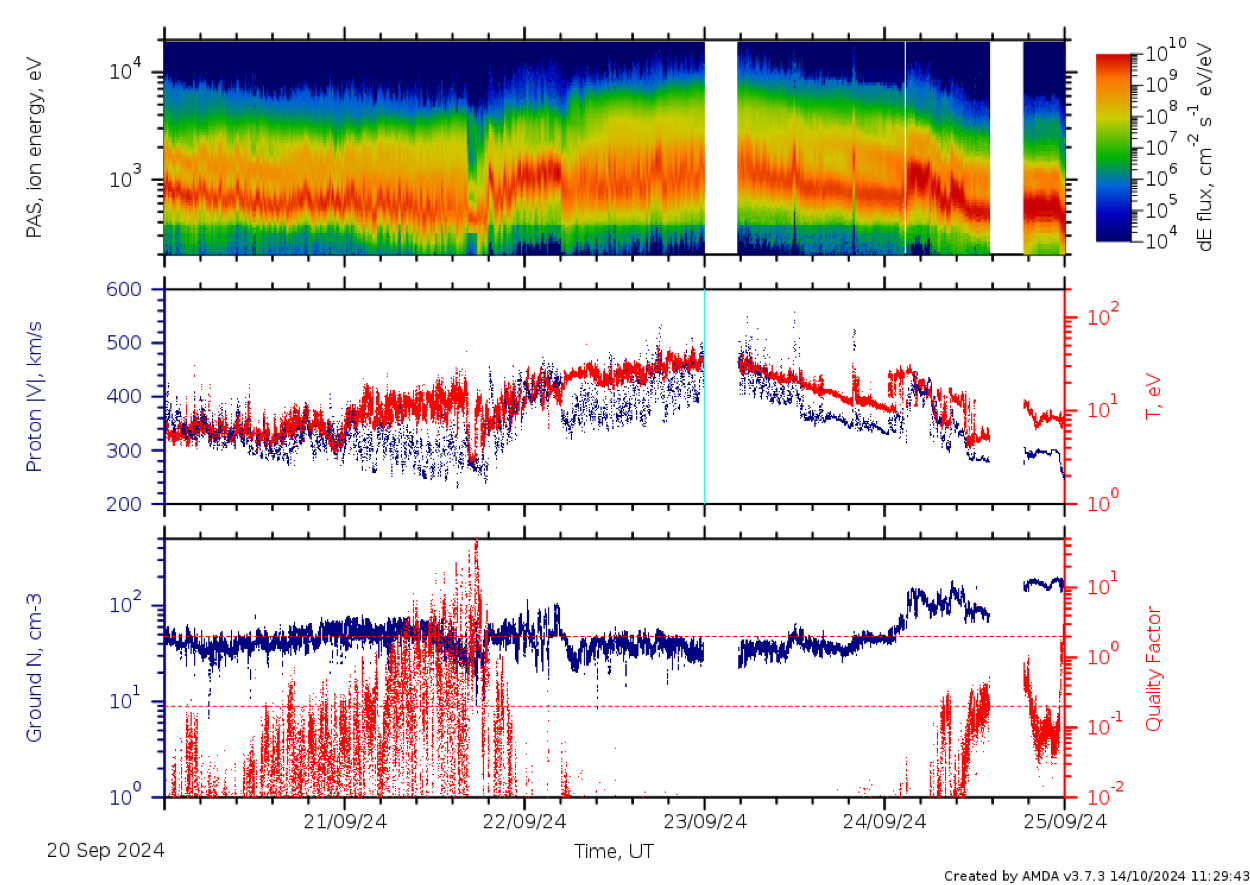
Figure 26. Slow/intermediate fast wind intervals. Clear small-scale (hours) spiky features. Very dense SW interval after Sep 24.
Slow, steady wind near Oct 2024 perihelion (0.3 AU)
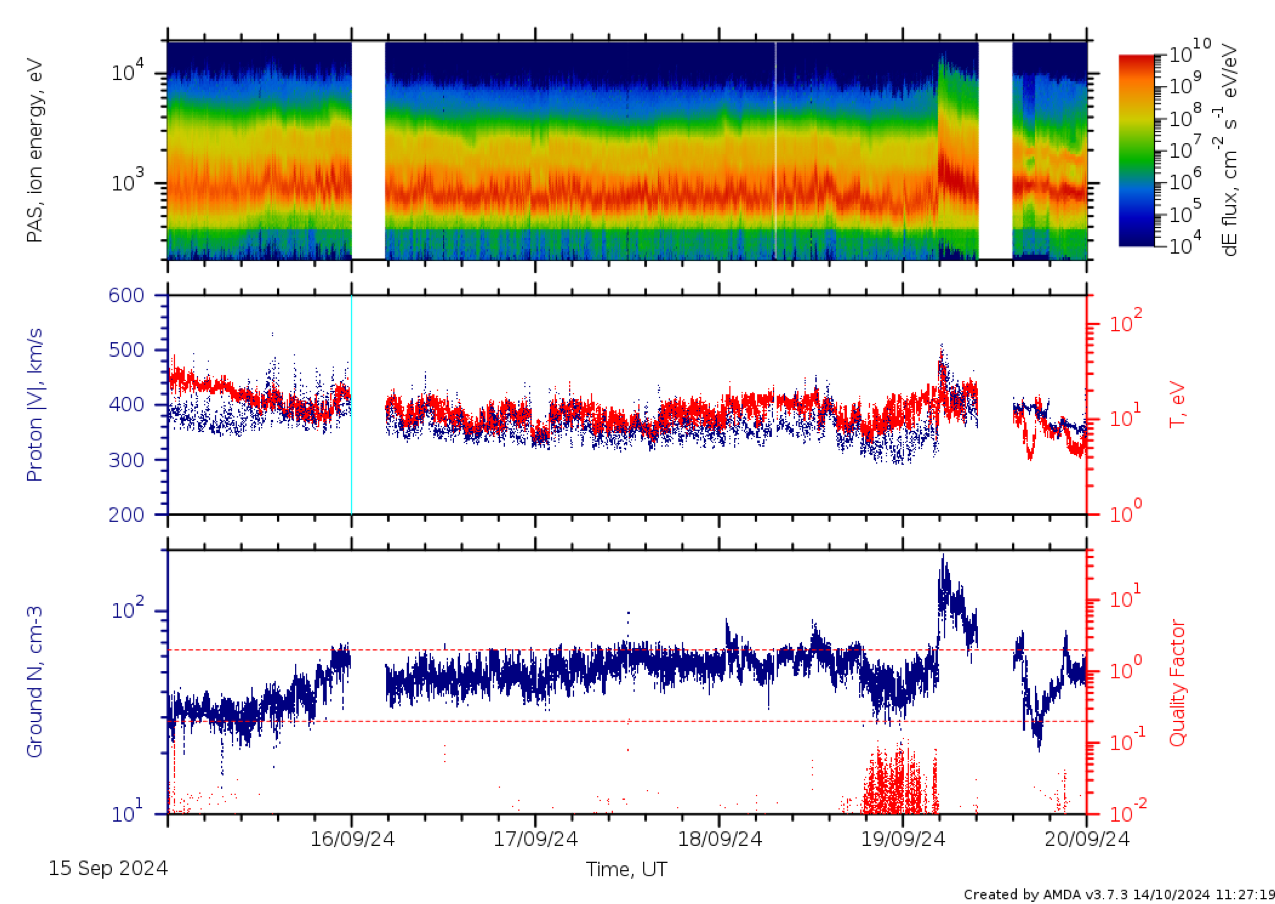
Figure 27. Slow, dense, and hot solar wind featured by spiky features (~ timescale of hours) in energy, velocity, temperature. A transition to intermediate/high-speed stream after Sep 30th.
ICMEs on Sep 9 – 14, 2024
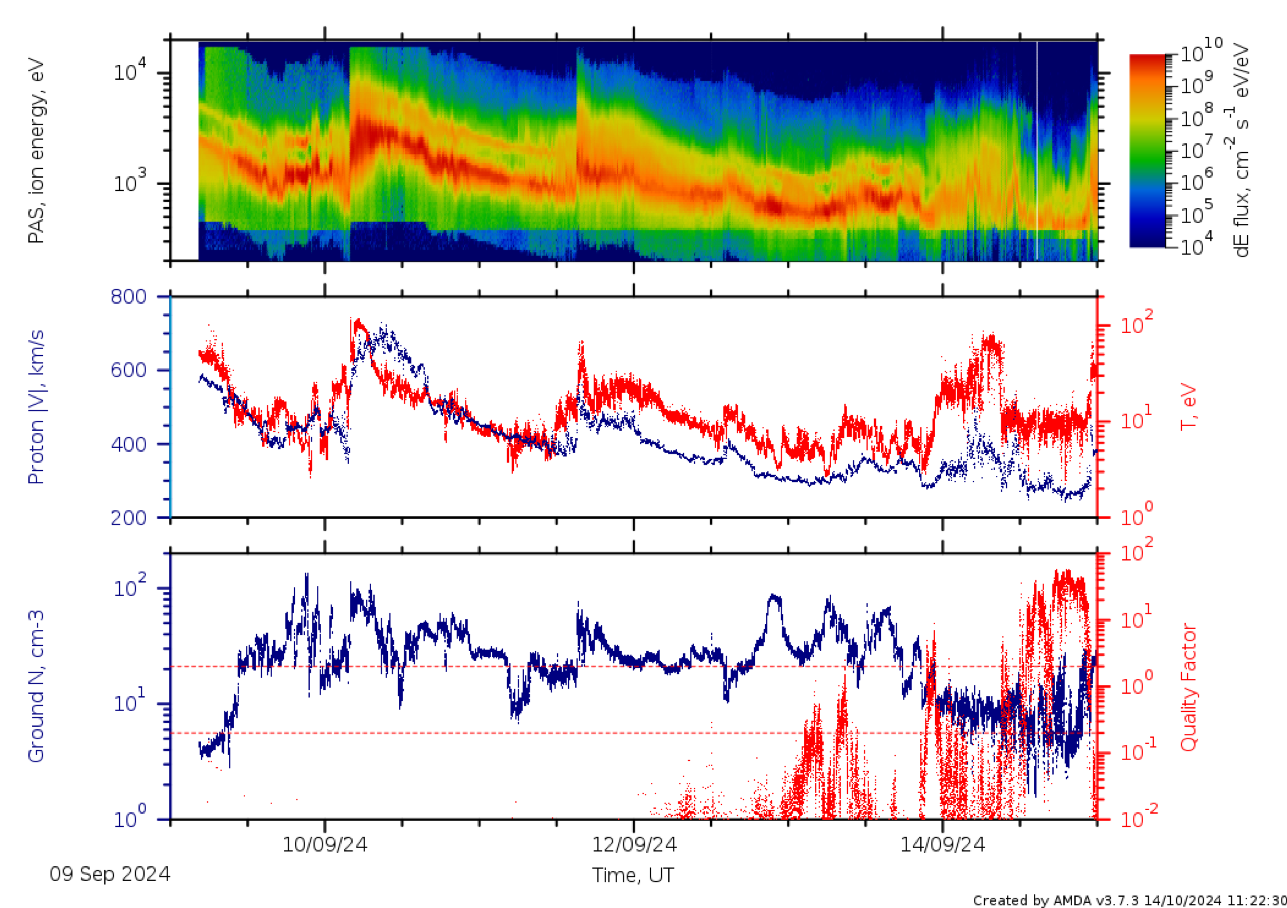
Figure 28. ICME with max H+ speed~ 700 km/s. Clear presence of non-thermal H+/He2+ populations (complex distribution functions).
ICMEs on Sep 4 – 9, 2024
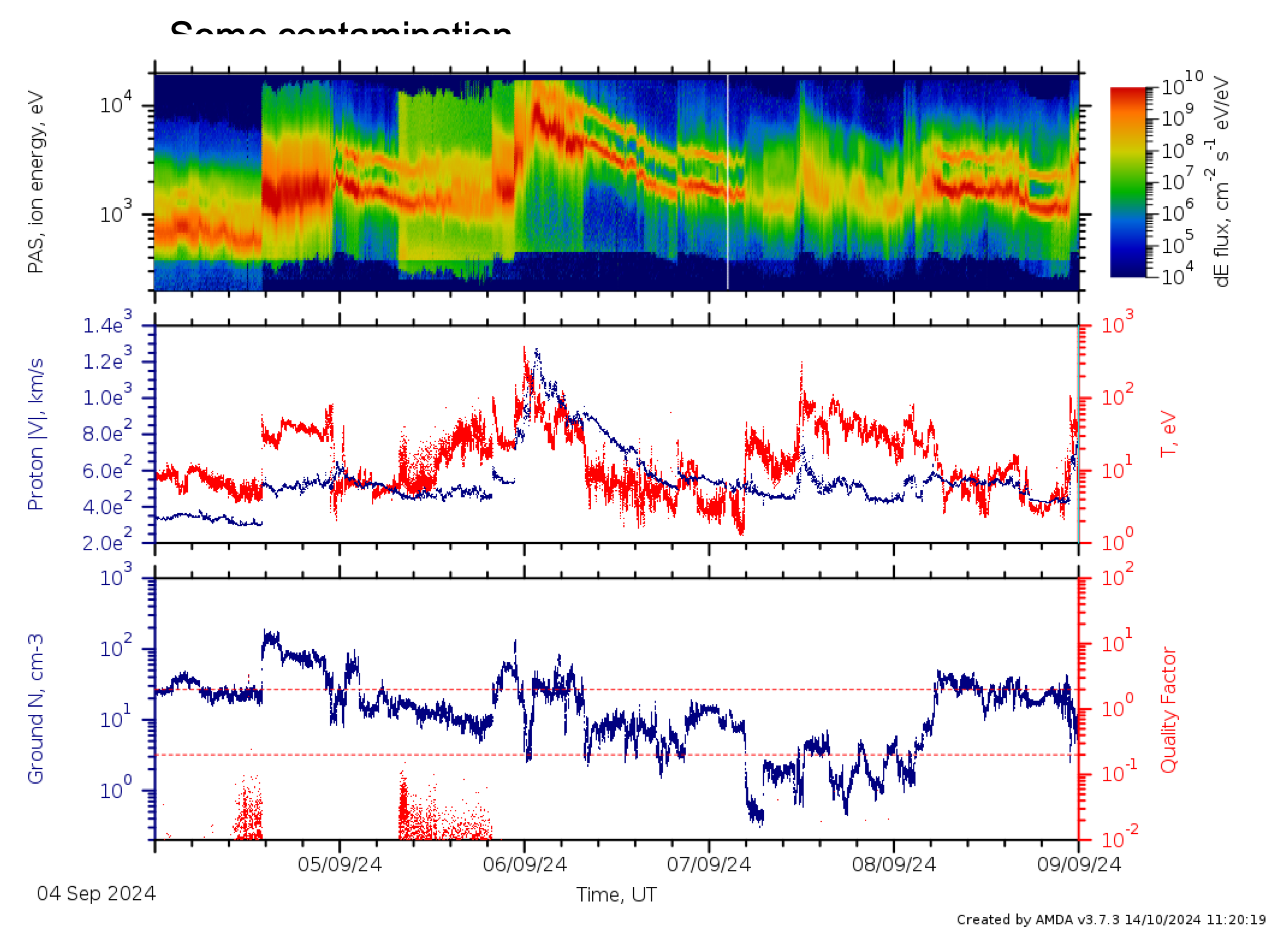
Figure 29. Clear shock and sheath on Sep 4 followed by cold, tenuous H+ and He2+ streams on Sep 5. Another ICME with two-step shocks on Sep 6 followed by alternating cold and hot intervals. Data contamination by photoelectrons on September 4 - 6 visible as uniform energy flux across all energies in green.
Shock, ICME on 24 - 31 July, 2024 (PAS 1s cadence)
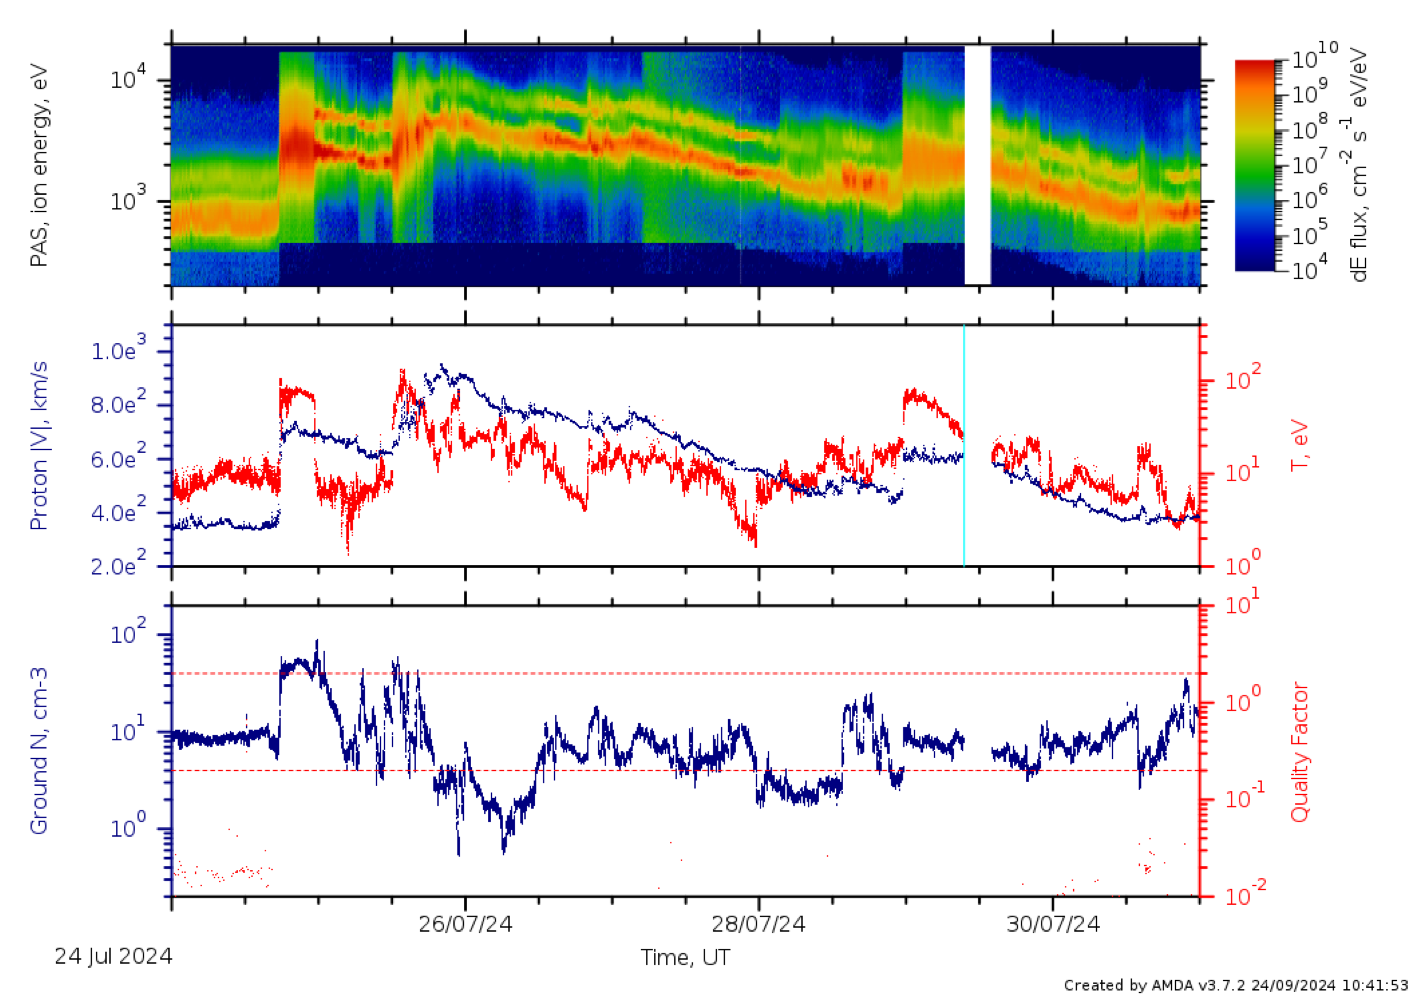
Figure 30. Shock-ICME sampled with PAS 1s cadence.
Shock, ICME on 24 - 28 July 2024
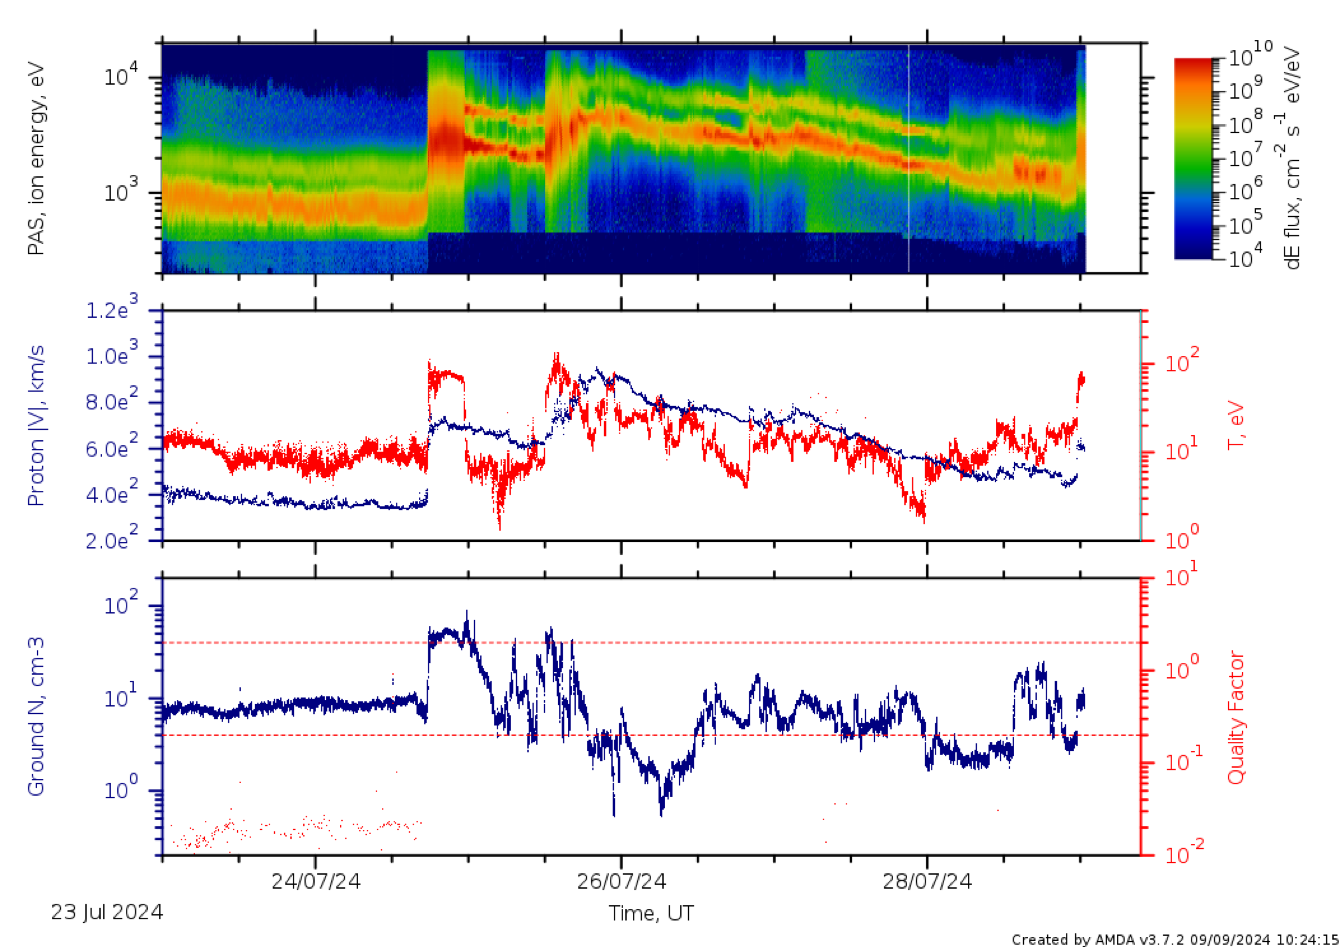
Figure 31. Detected with PAS 1s data. Shock with V jump of 400 km/s. Clear sheath behind the shock. Proton speed in ICME ~ 1000 km/s. Secondary electron contamination on 23rd and 27th July.
Fast, hot stream on 10 July 2024
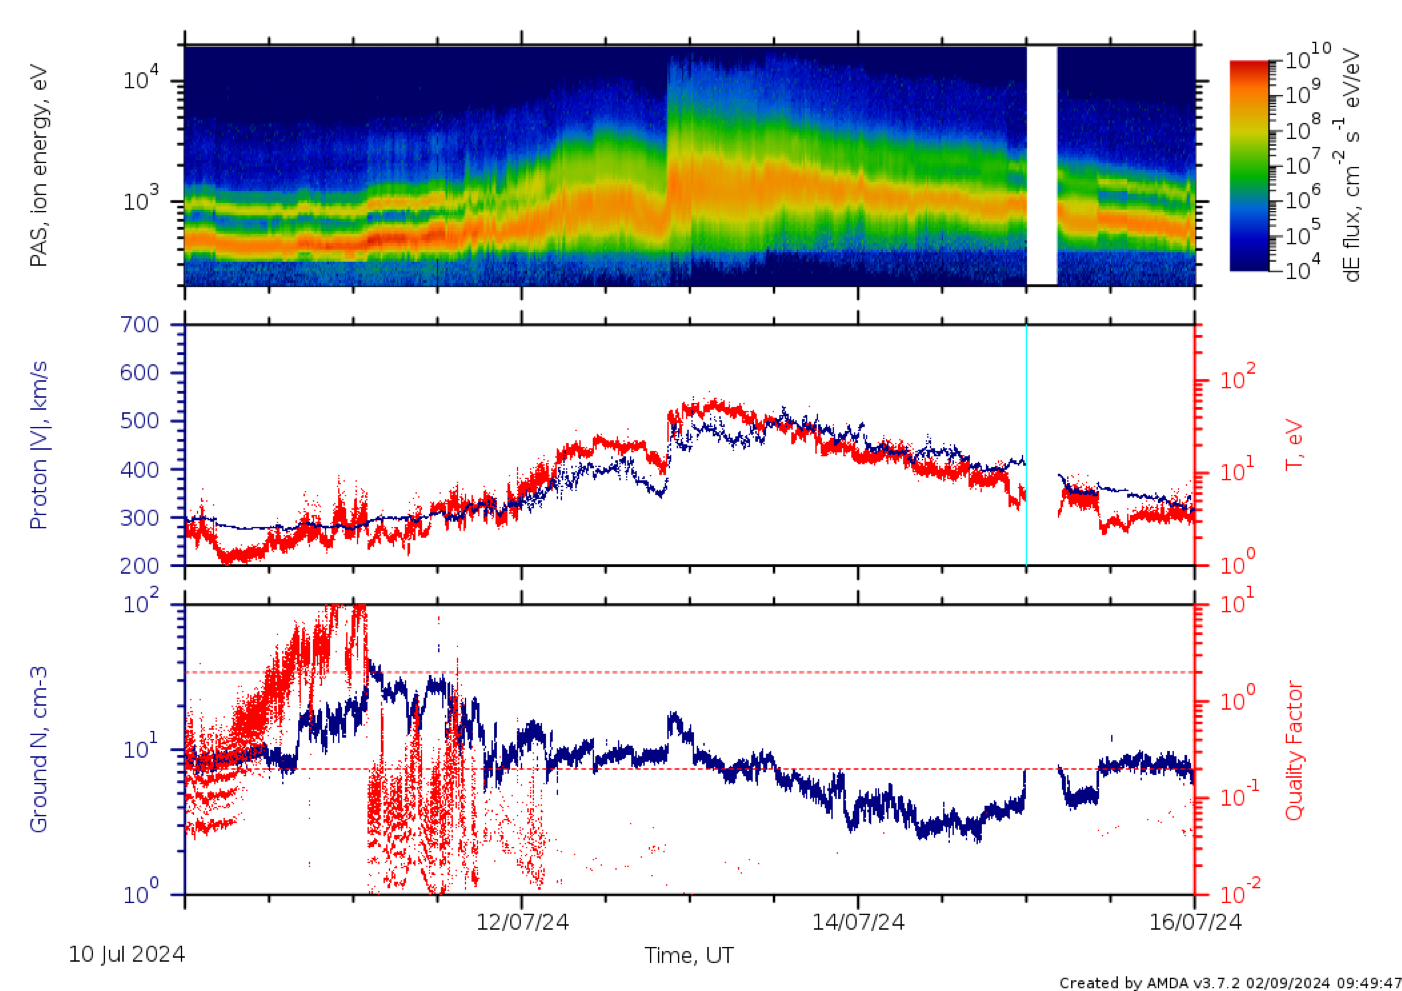
Figure 32. Fast and hot stream (correlated velocity and temperature).
ICME on 19 - 22 June 2024
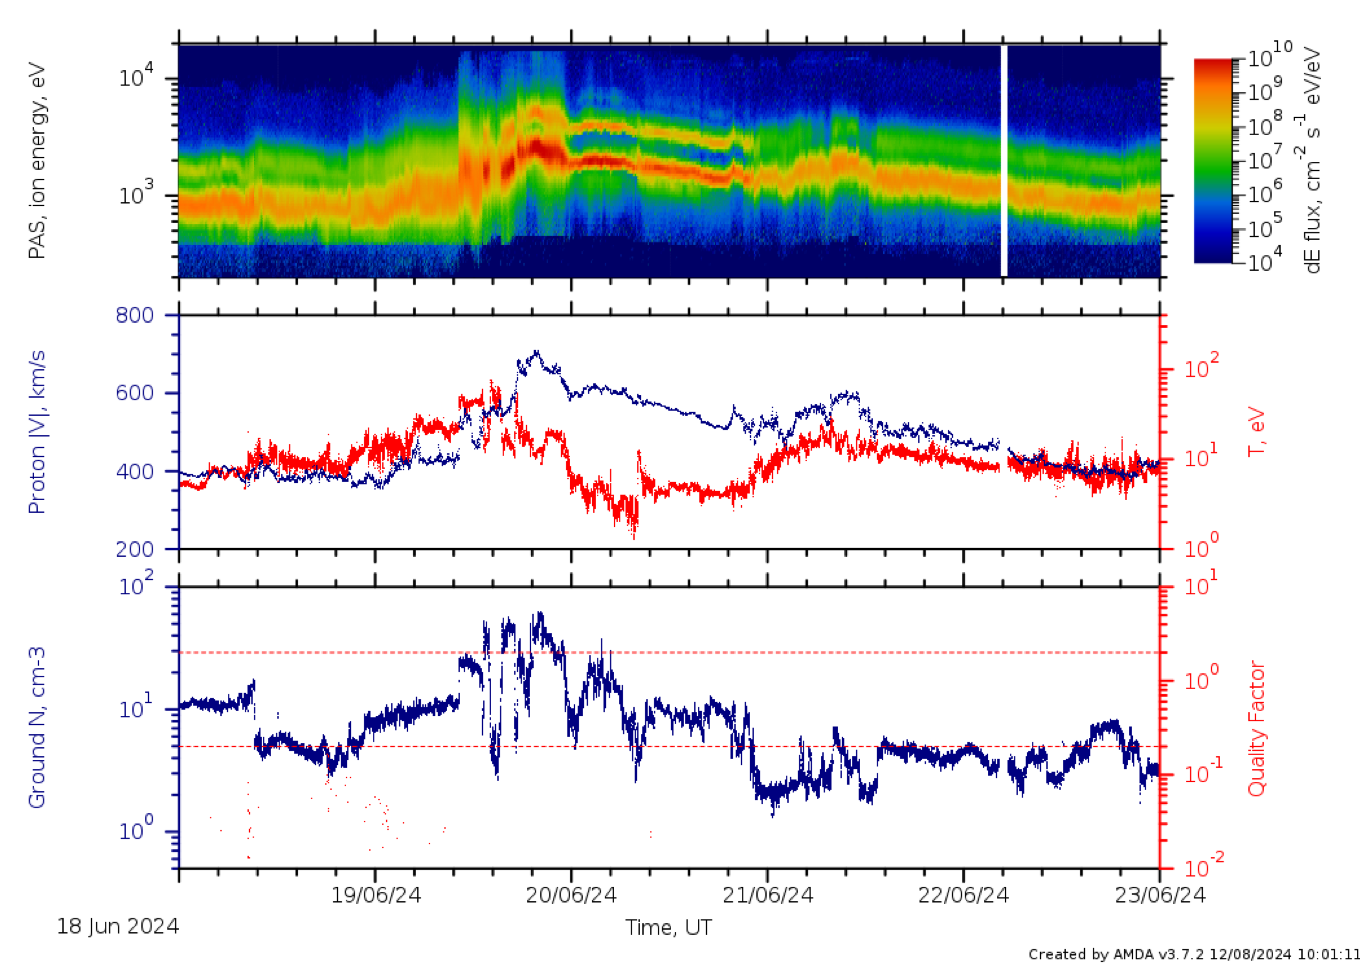
Figure 33. ICME detected at 0.94 AU with clear alpha particles and some additional ion species. Cold materials.
Two shocks on 13 - 14 June 2024
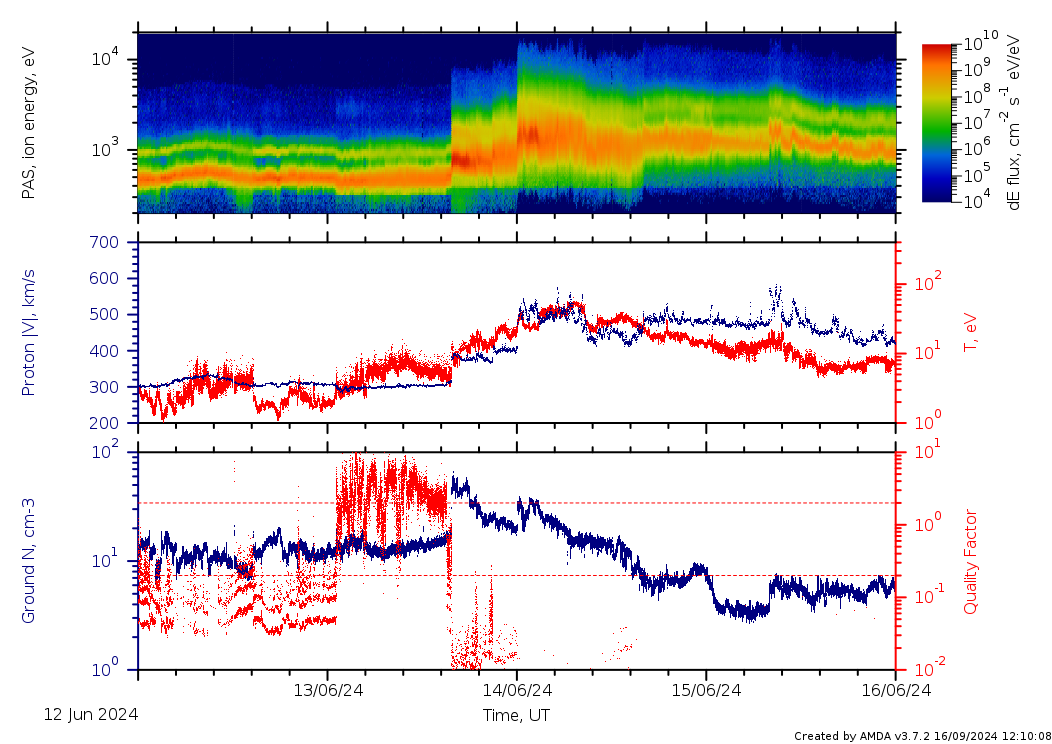
Figure 34. Two-step shocks on 13 - 14 June 2024.
ICME on May 21st
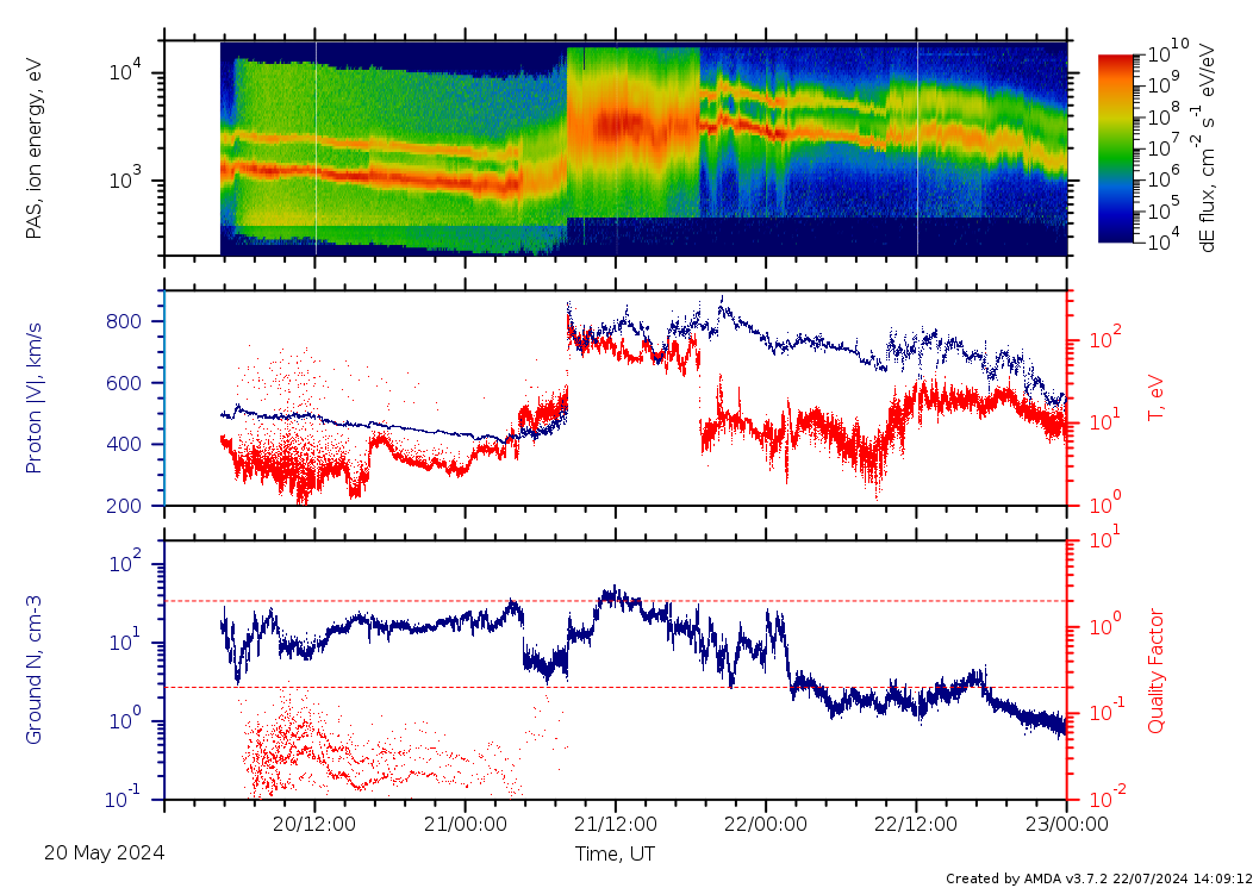
Figure 35. An ICME preceded by a shock. Velocity jump > 200 km/s. Photoelectron contamination visible as uniform energy flux at all energies.
ICME on May 9th (0.68 AU)
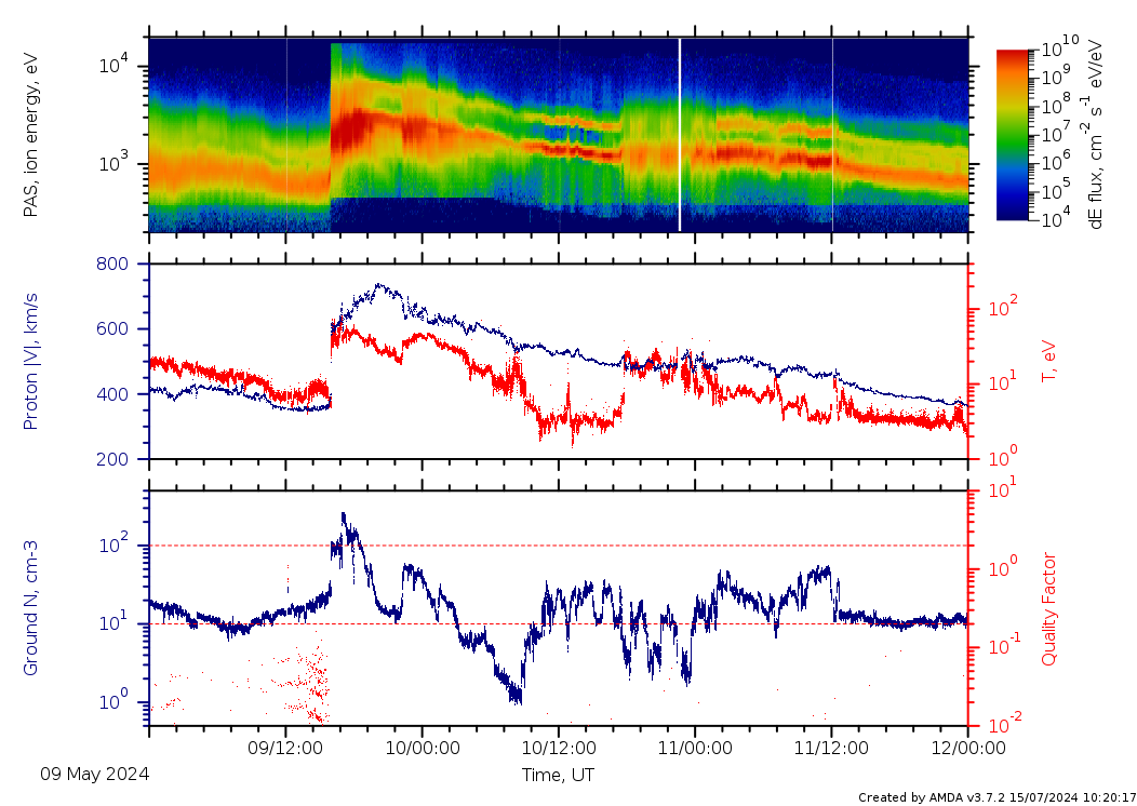
Figure 36. An ICME preceded by a shock. Velocity jump ~ 200 km/s. Plausibly clear flux rope structure. Clear alpha energy flux throughout.
ICME at 0.45 AU with some heavy ions
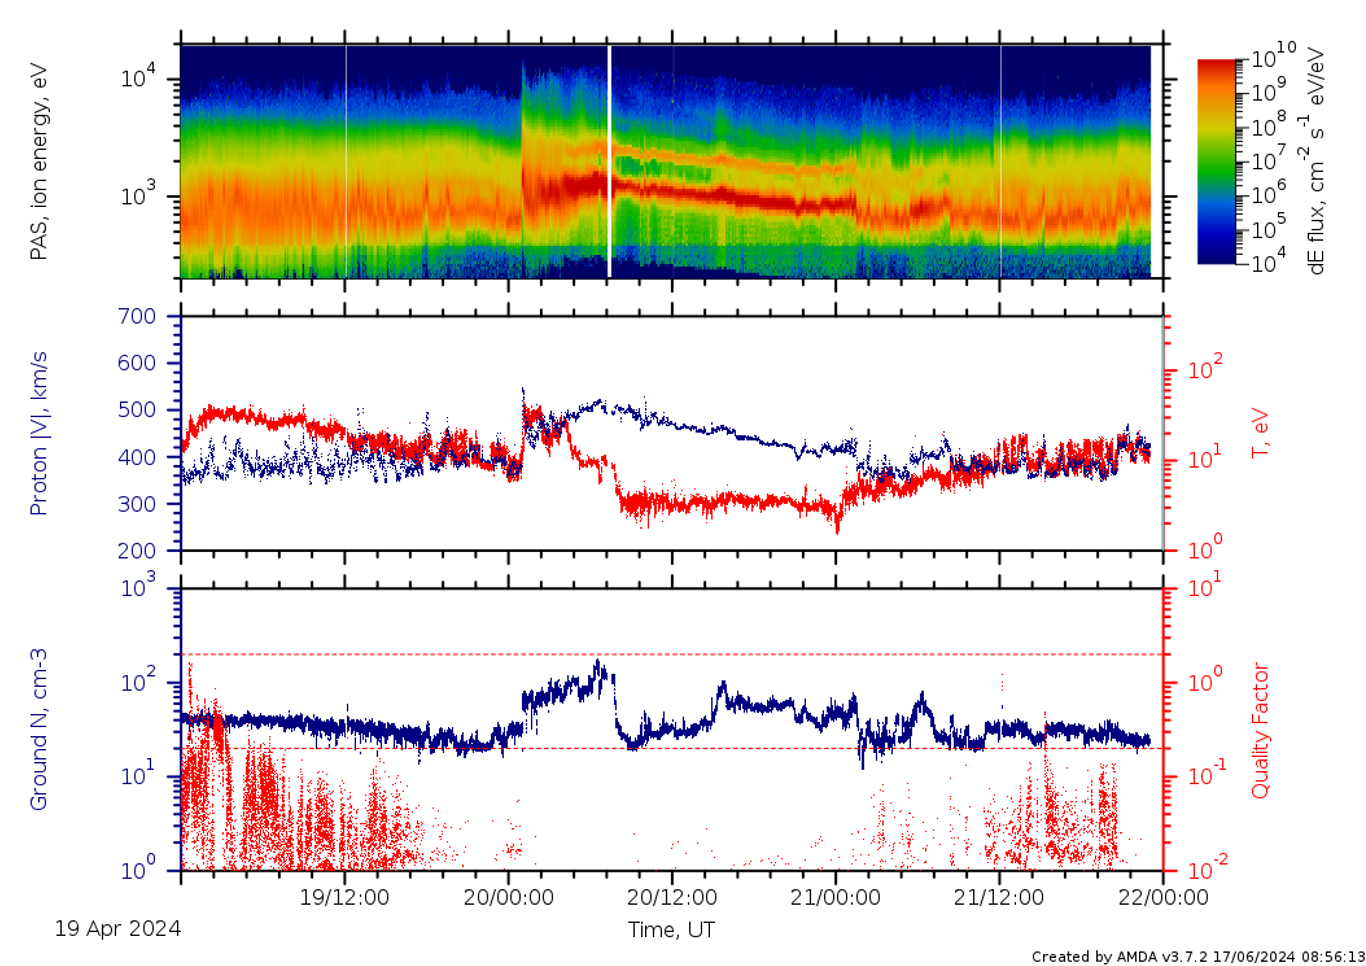
Figure 37. An ICME at 0.45 AU with a shock and plausibly a flux rope with cold prominence materials. An additional species above He2+ omnidirectional energy flux.
Dense wind and a shock in slow wind
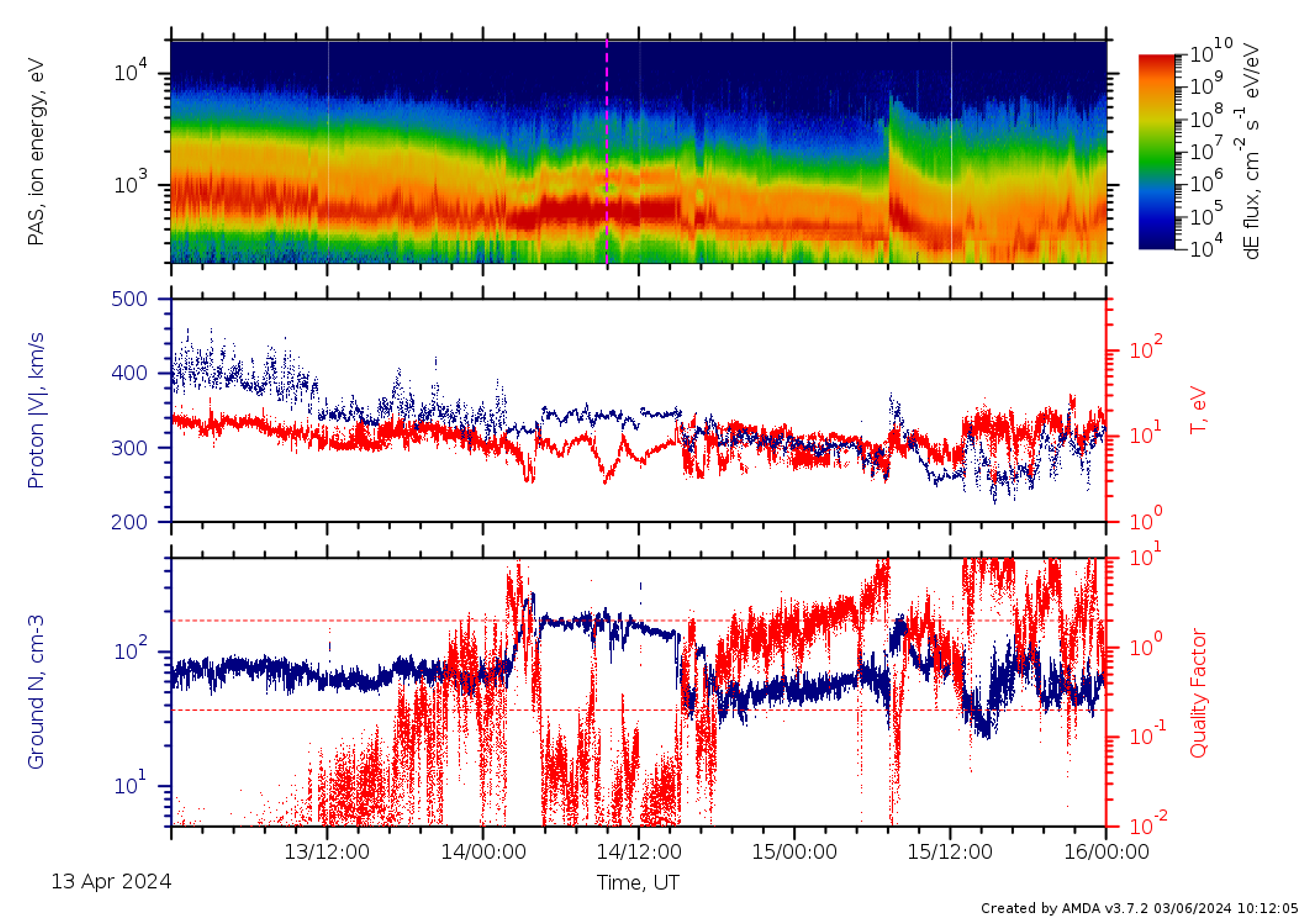
Figure 38. Slow (V~ 350 km/s) and dense (200 /cc) wind with multiple populations and additional species.
Fast wind near the perihelion with jets
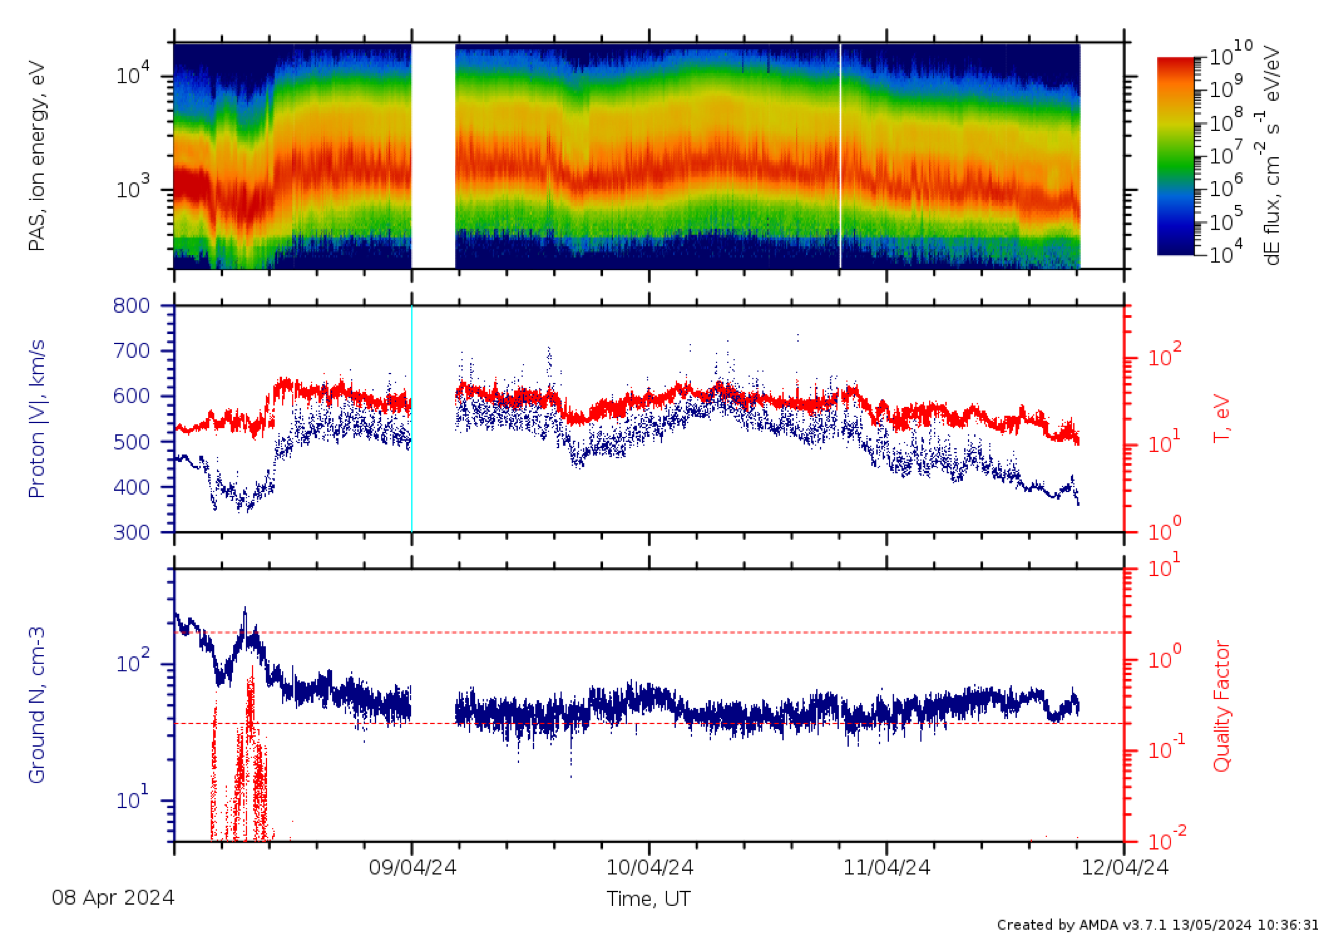
Figure 39. Fast-/intermediate-speed wind on April 8th – 12th at 0.35 AU with a presence of jets throughout.
Dense wind near the perihelion (0.32 AU)
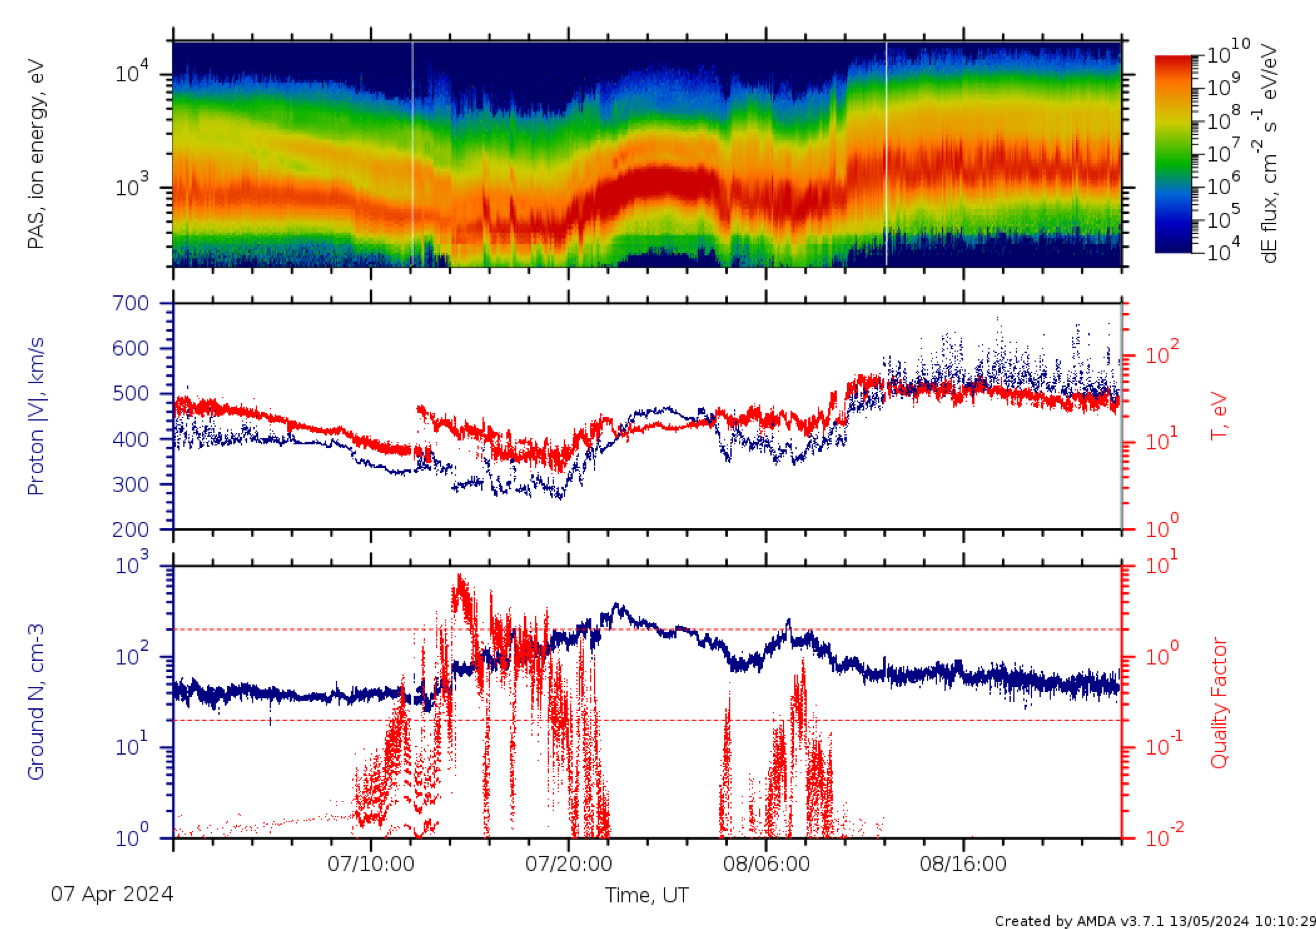
Figure 40. Dense wind interval preceding a high-speed stream. Presence of jets and sub-populations.
Perihelion Mar - Apr 2024
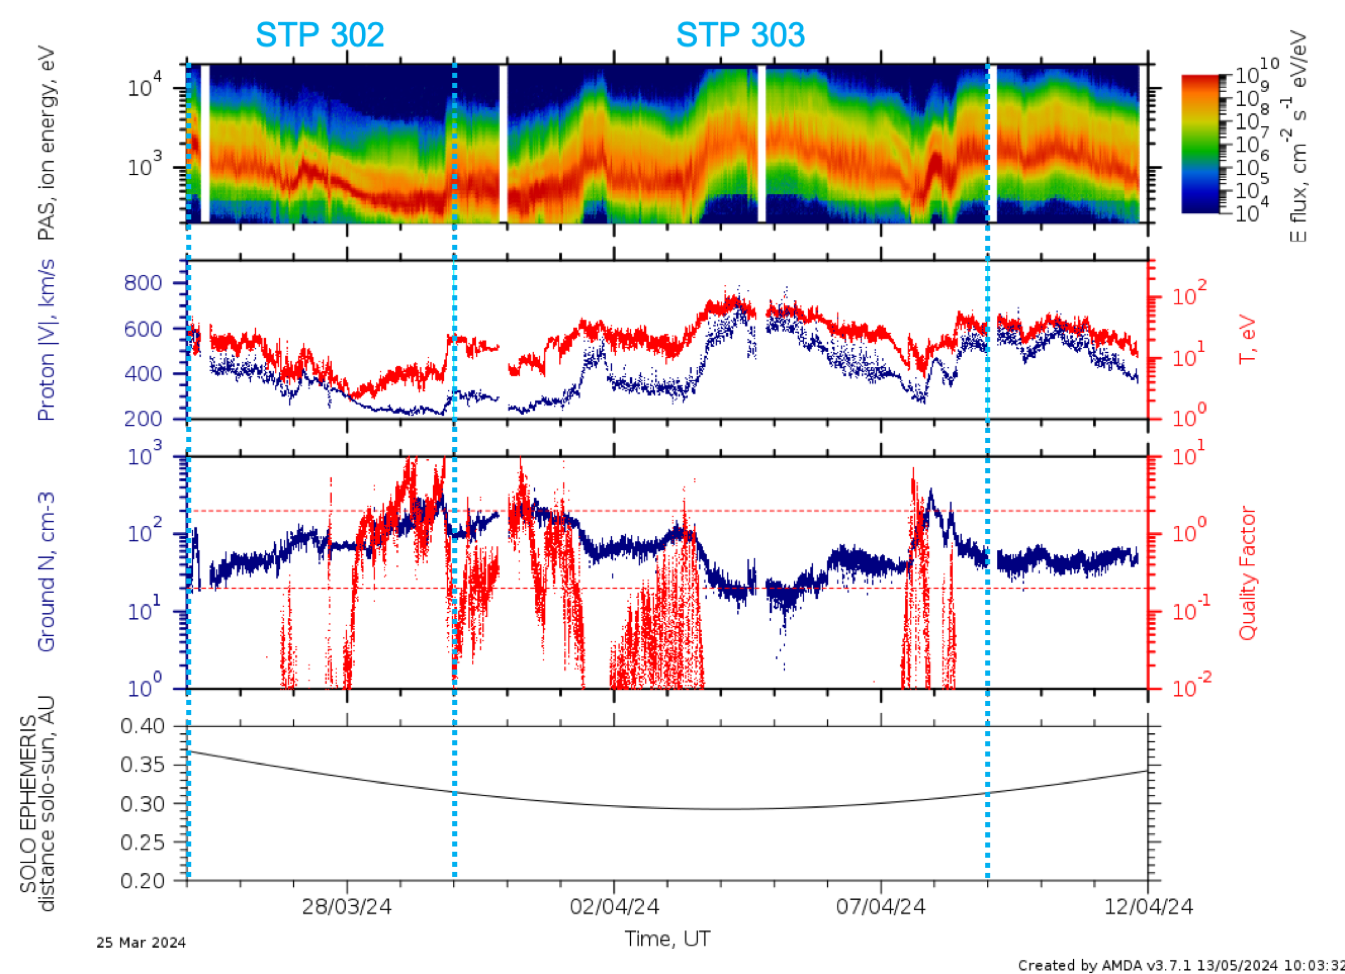
Figure 41. March – April 2024 Perihelion data (0.29 AU).
Stream in the vicinity of the perihelion
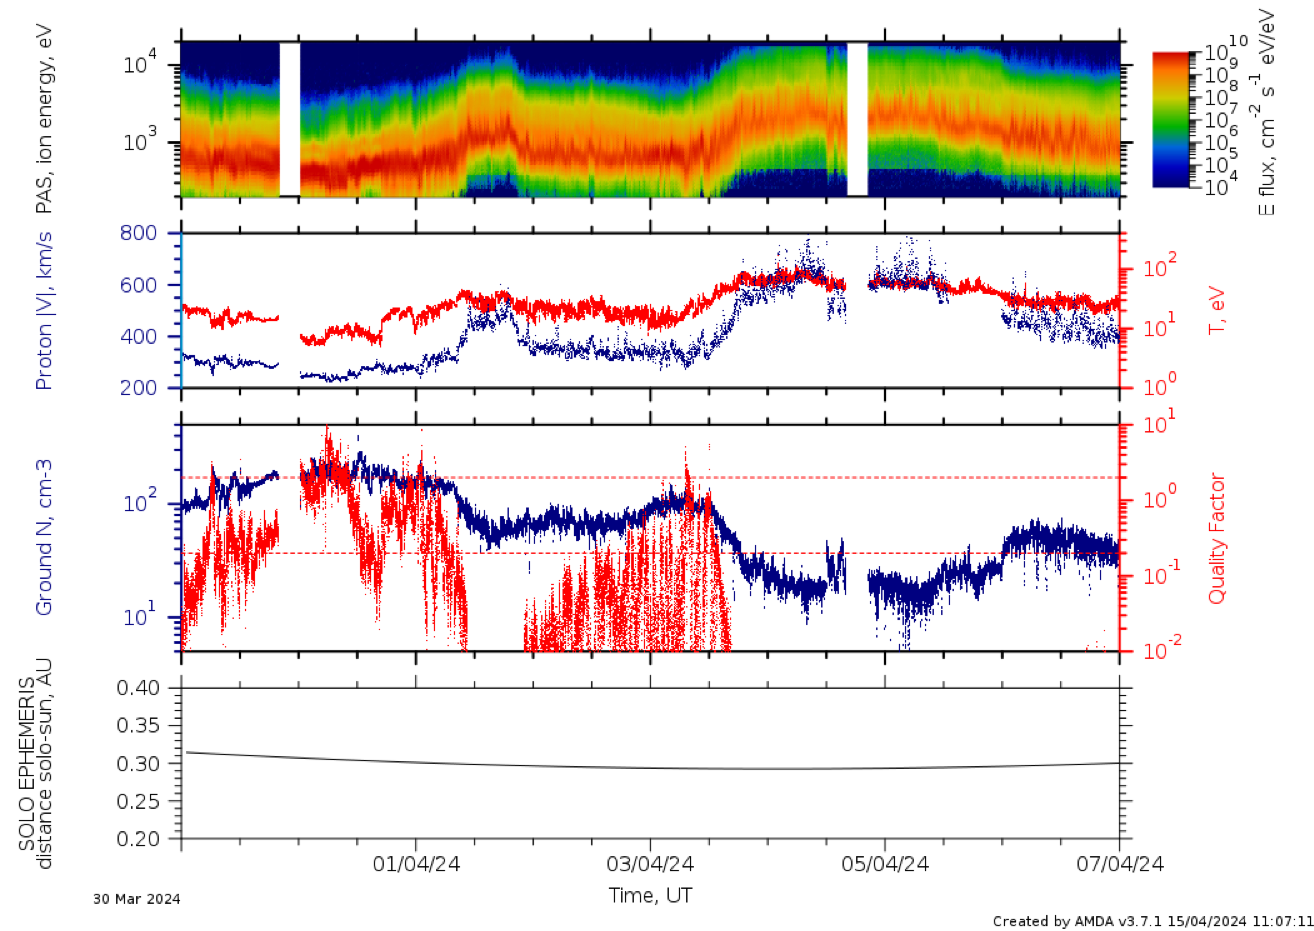
Figure 42. Slow and high-speed streams with broad energy flux. Presence of strong non-thermal H+ population.
Shock, ICME on 23rd March 2024 (0.39 AU)
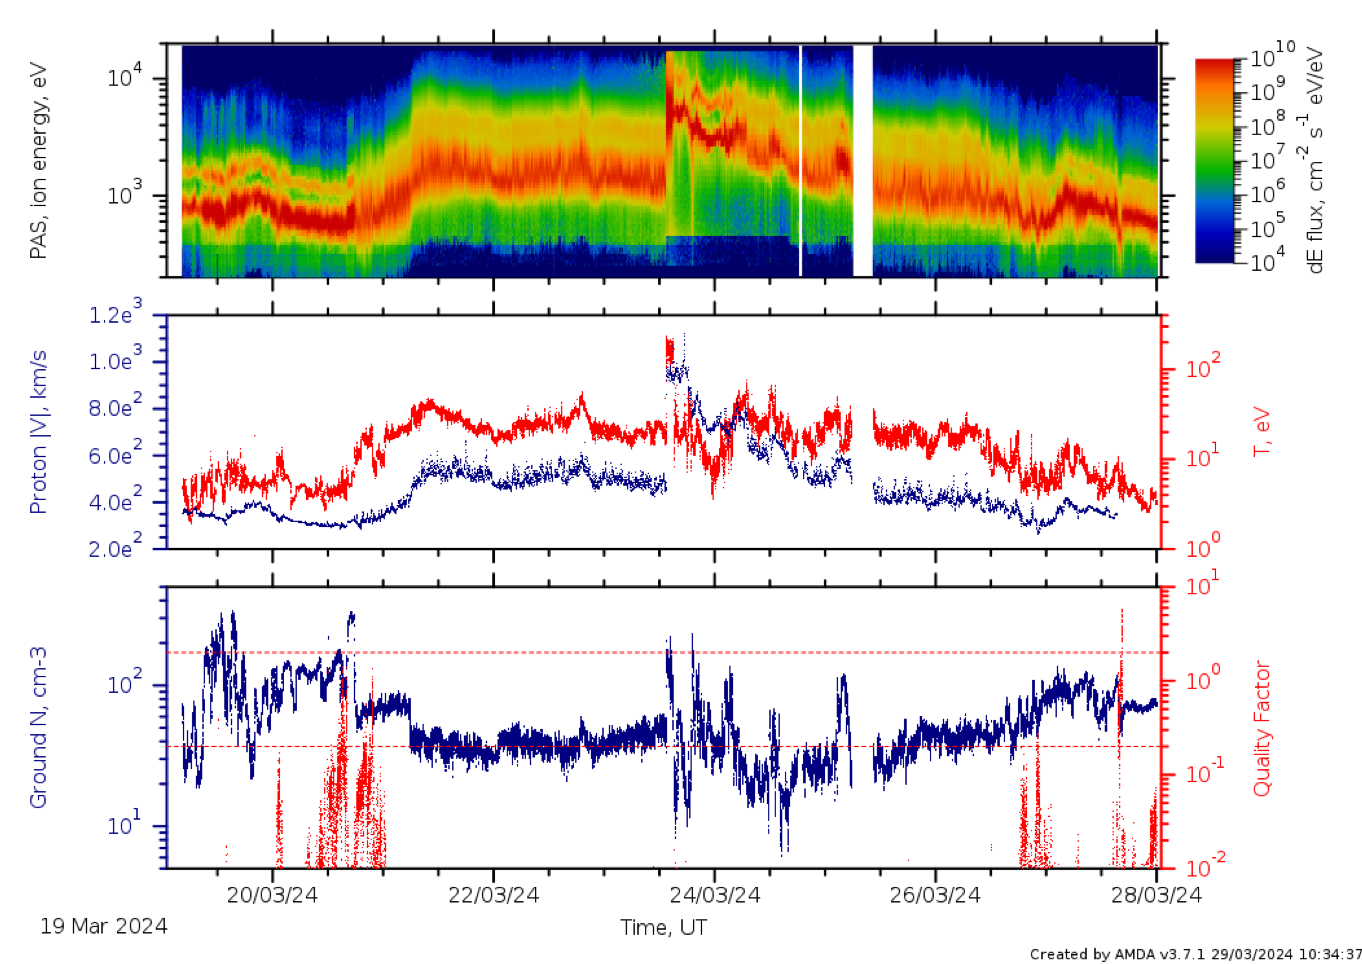
Figure 43. Overview.
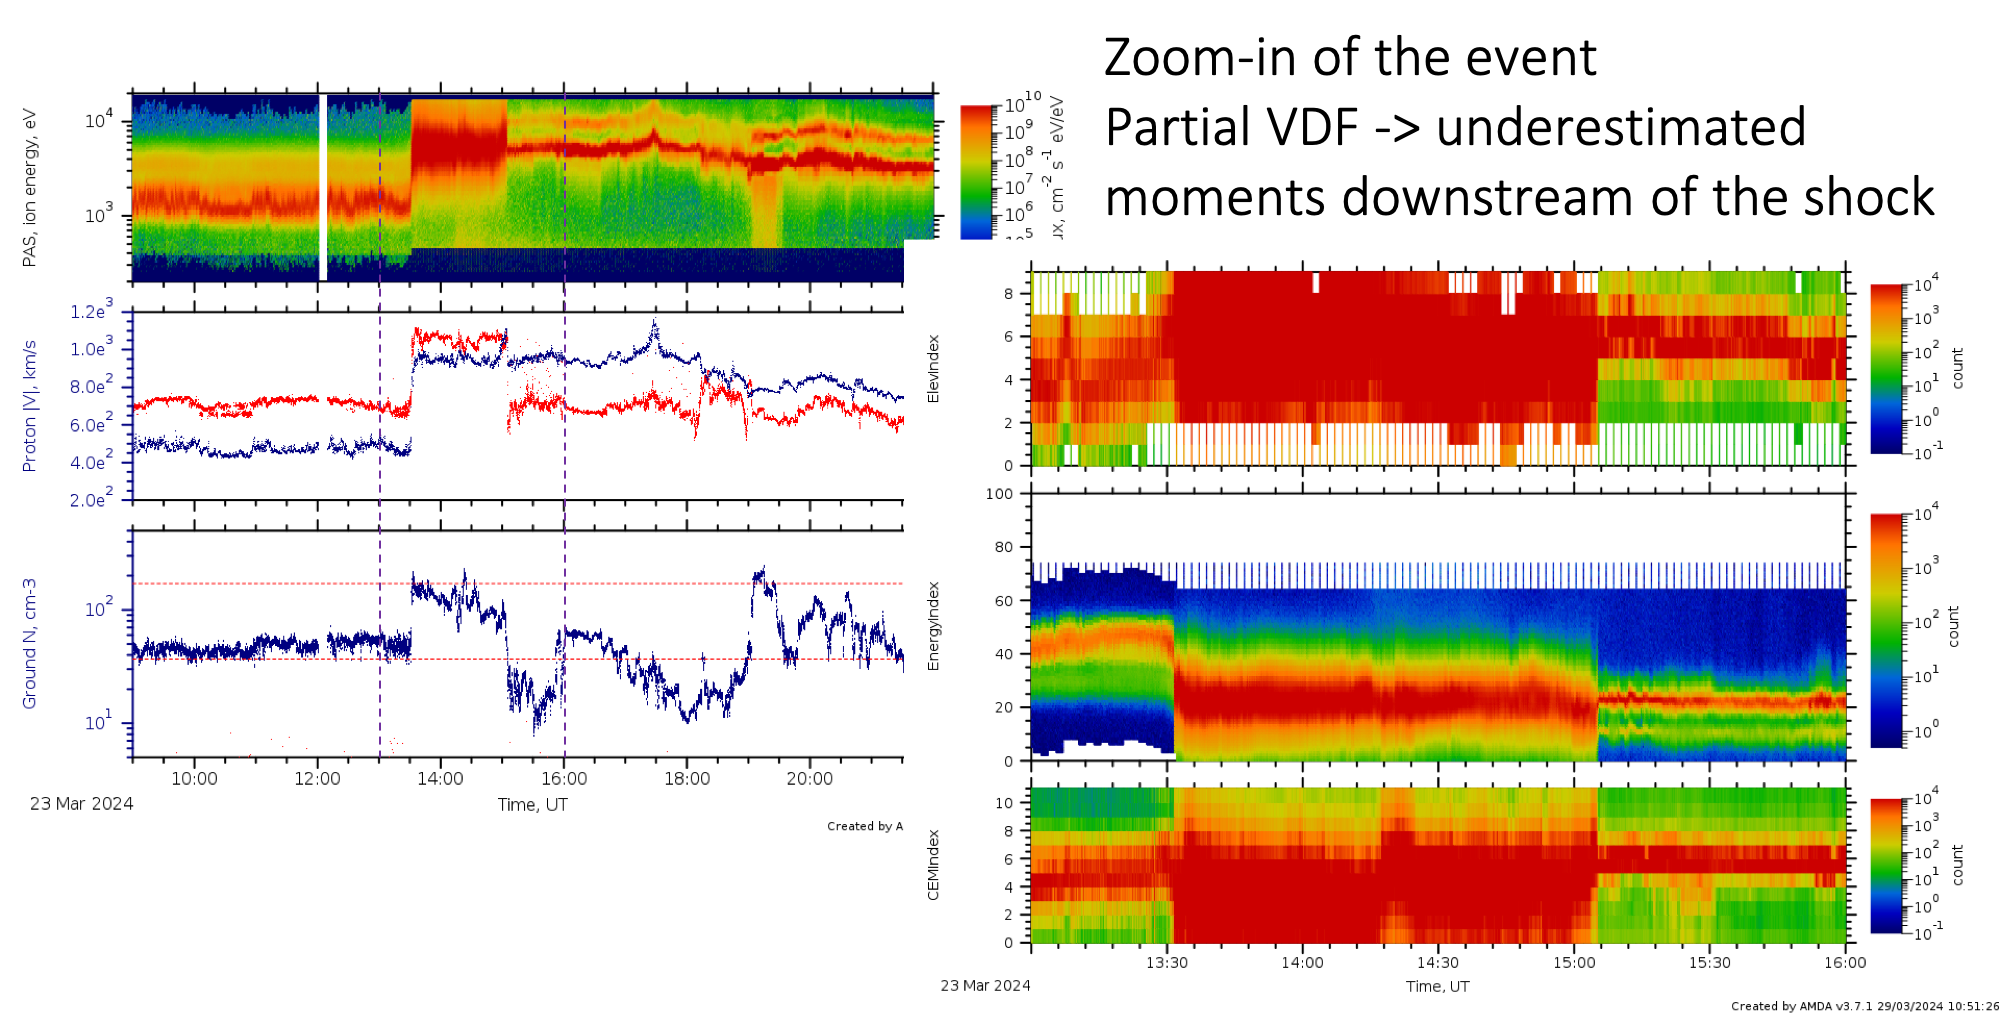
Figure 44. Zoom-in.
Overview on Dec 2023 – March 2024
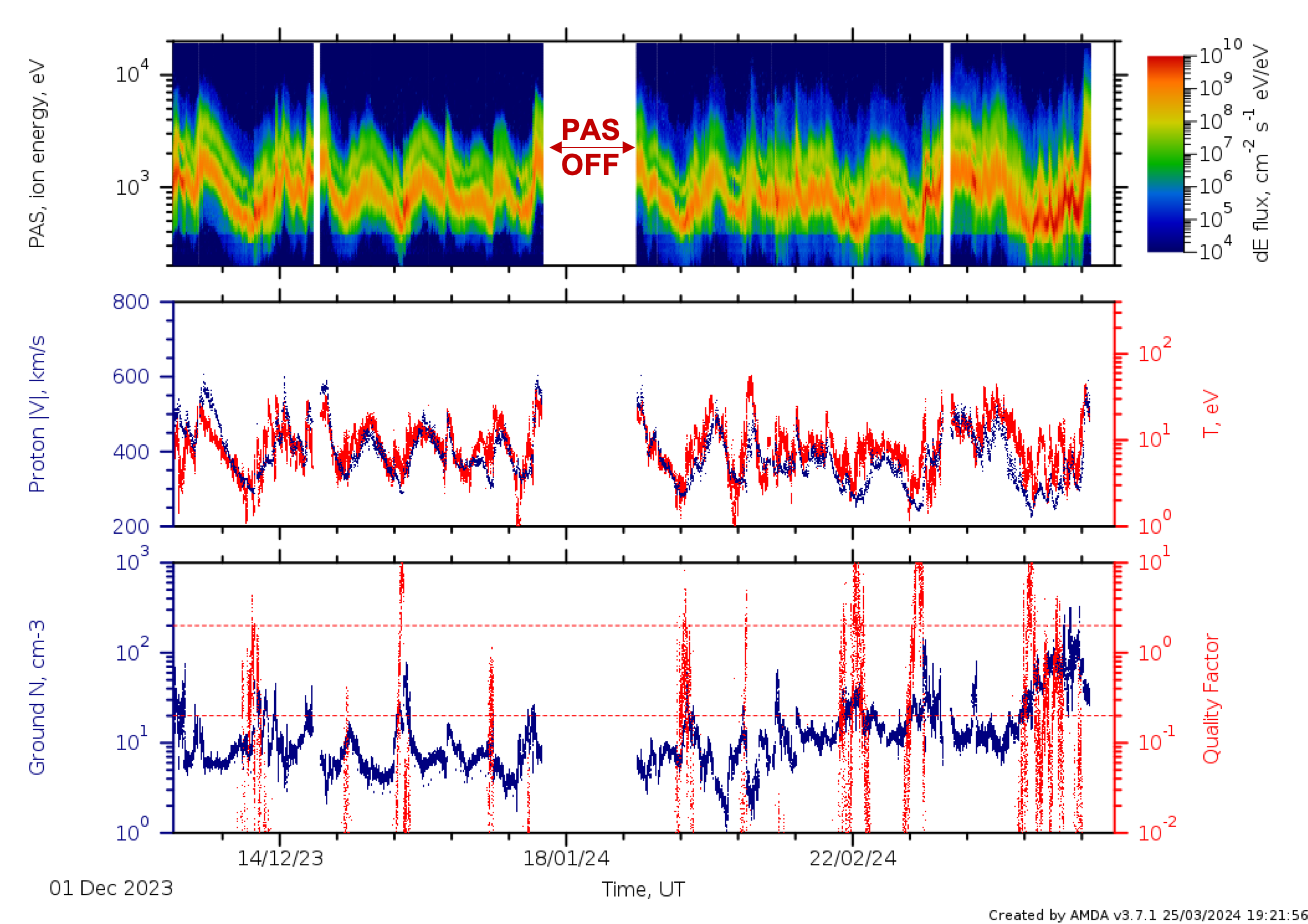
Figure 45. Note: the new PAS high cadence tests (1s or 2s) were running from Nov 2023 – 10 March 2024. There are several intervals with partial VDFs. PAS is on 2s cadence from March 11, 2024.
Shock, ICME on 29th - 30th Nov 2023
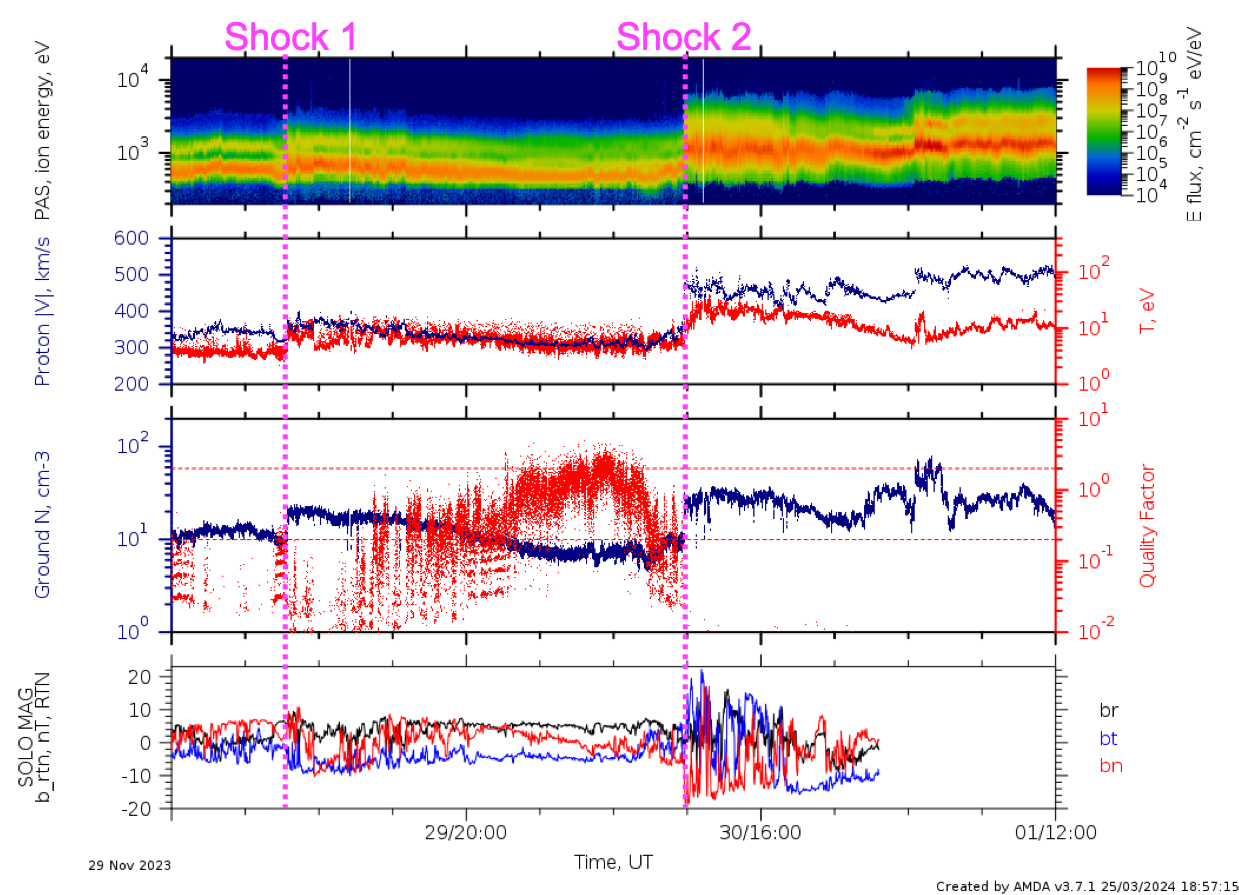
Figure 46. PAS was in 1s cadence, some partial VDF with 5 elevations. Nice wave activities upstream of the shocks seen by MAG.
Shock, ICME on 11th Nov 2023 (0.68 AU)
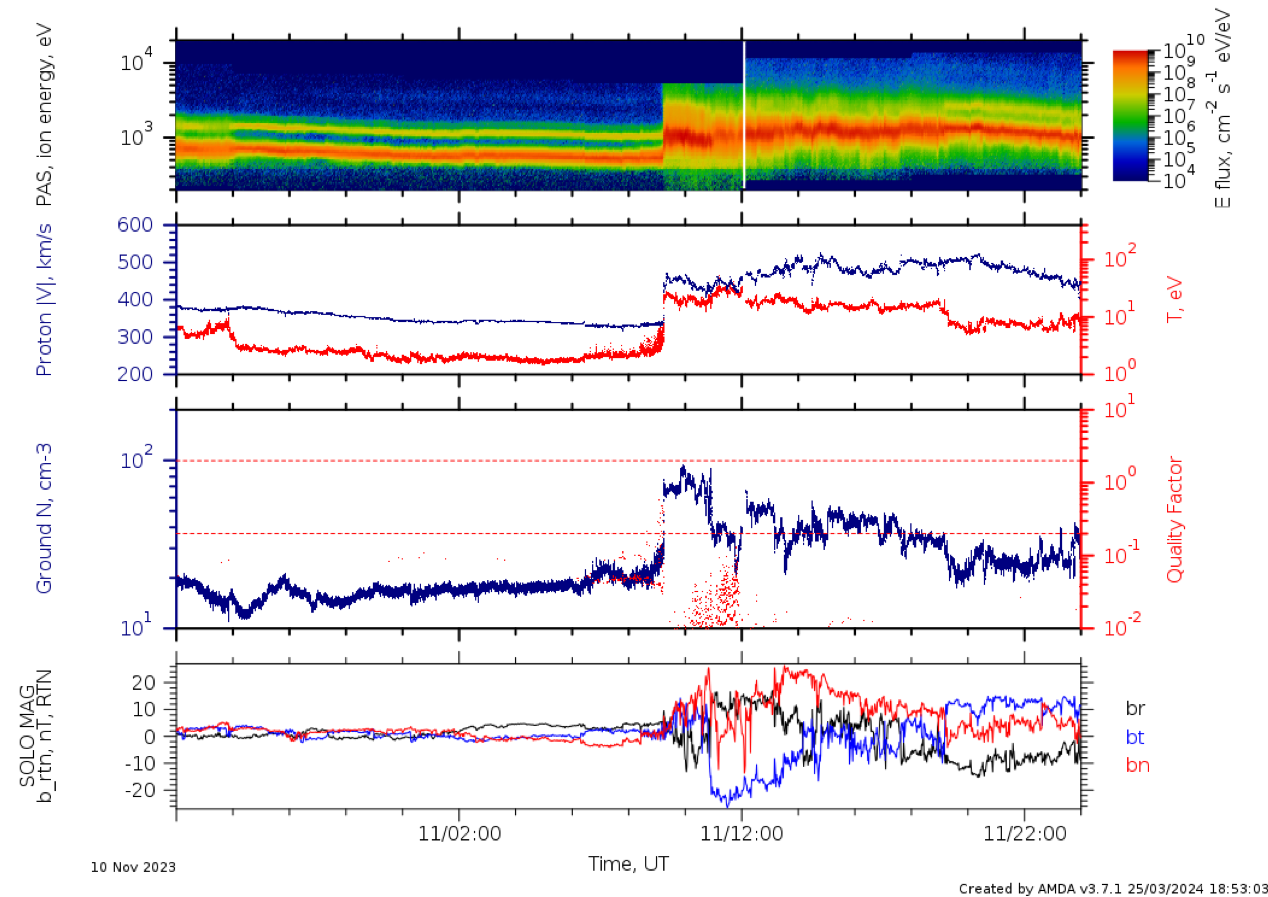
Figure 47. IP shock or shock/ICME in moderate speed wind, calm upstream conditions.
Shock, ICME on 17th Oct 2023 (0.3 AU)
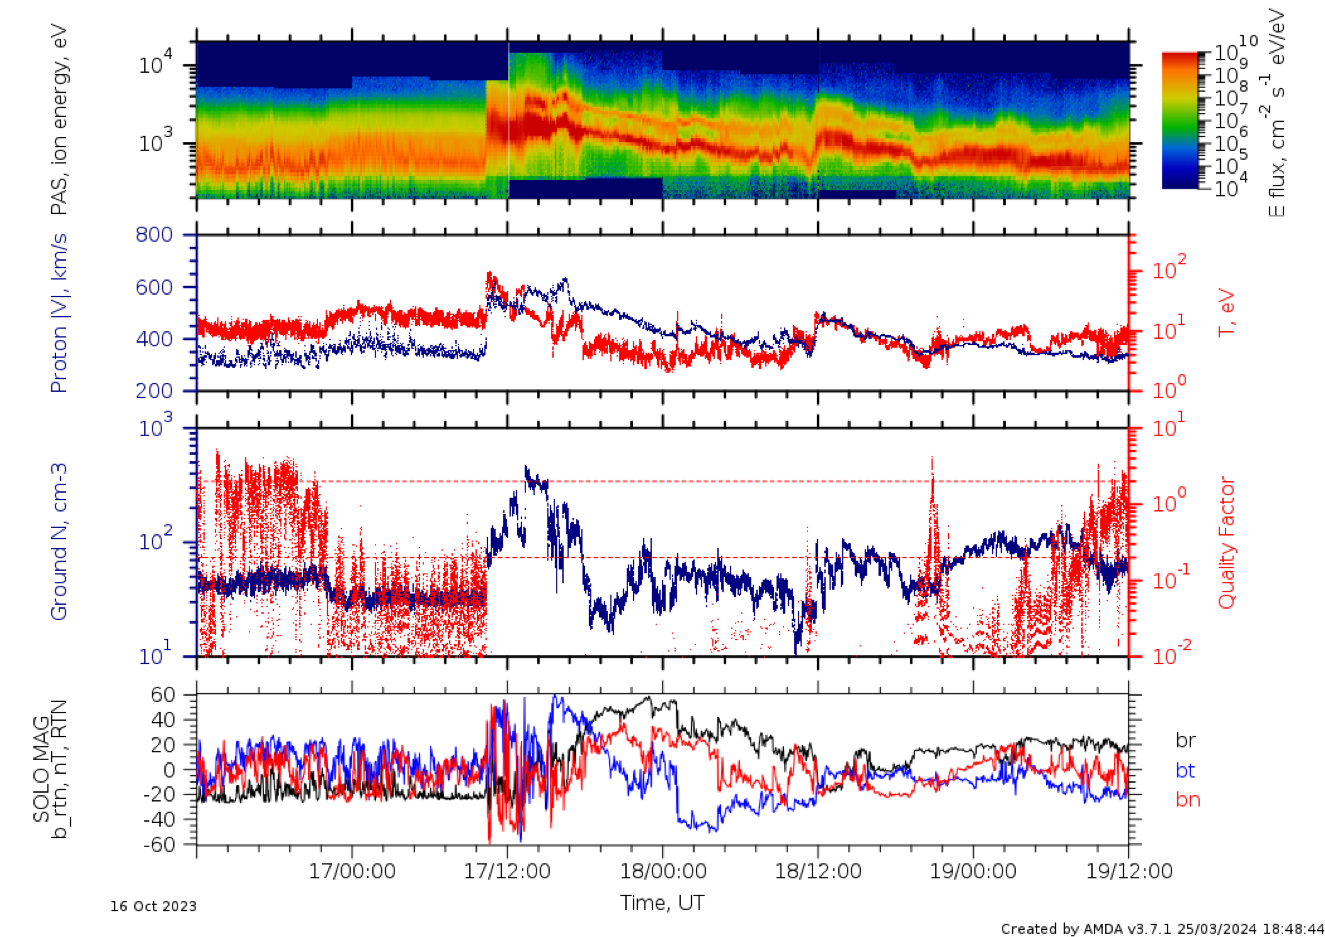
Figure 48. Shock/ICME in slow wind with high alpha density in the trailing edge.
Shock, ICME on 11th Oct 2023 (0.3 AU)
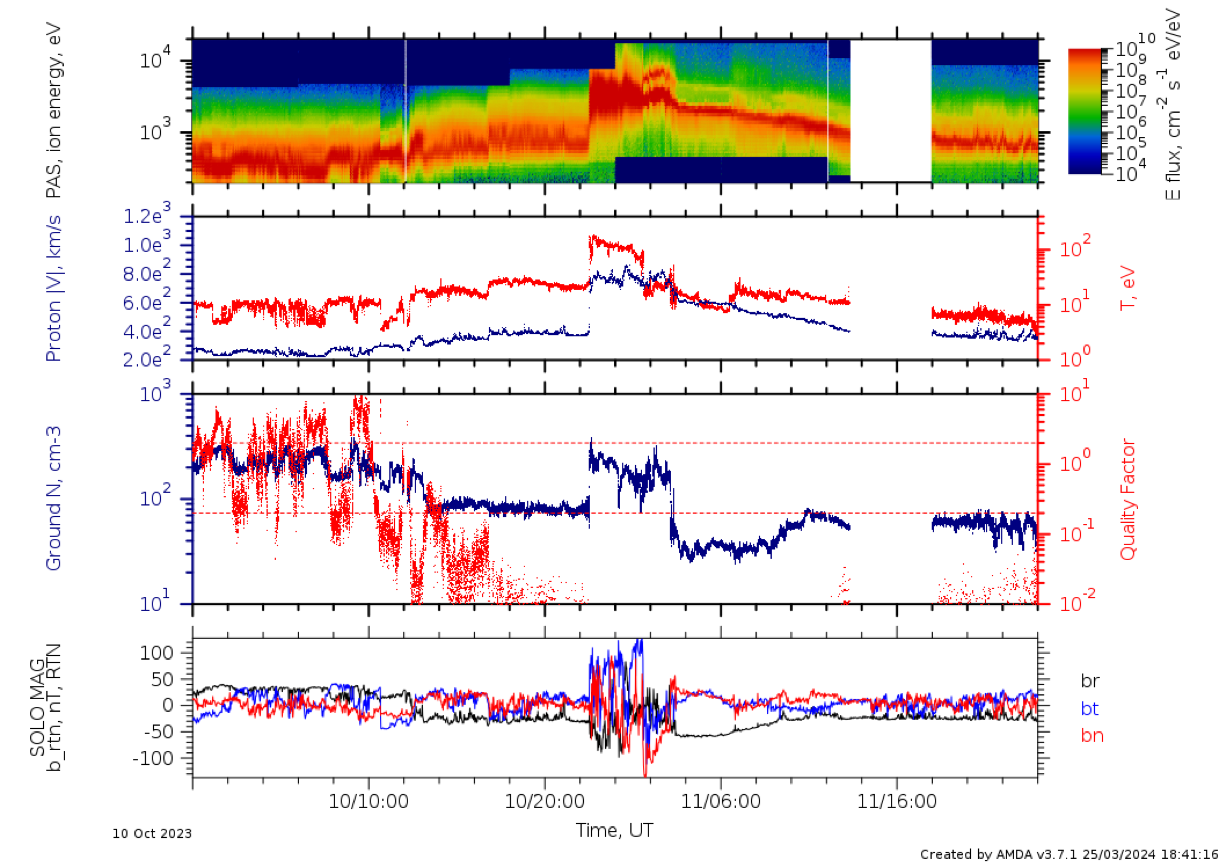
Figure 49. Dense ICME. Only partial VDF at the beginning of the interval.
Shock, ICME on 4th Oct 2023 (0.3 AU)
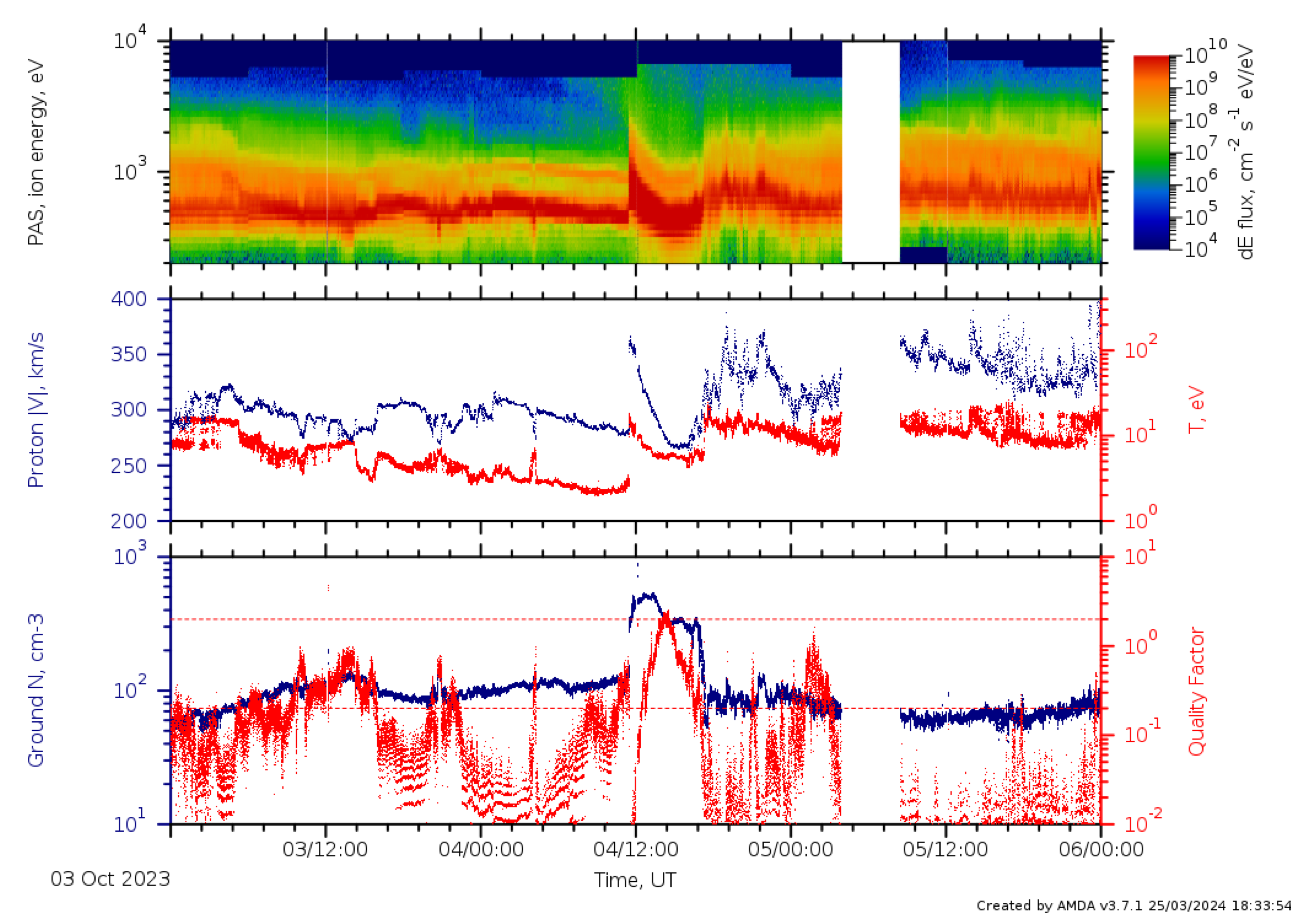
Figure 50. Hot, slow streams at 0.3 AU. Some visible reflected ions upstream of the shock.
Perihelion Sep - Oct 2023
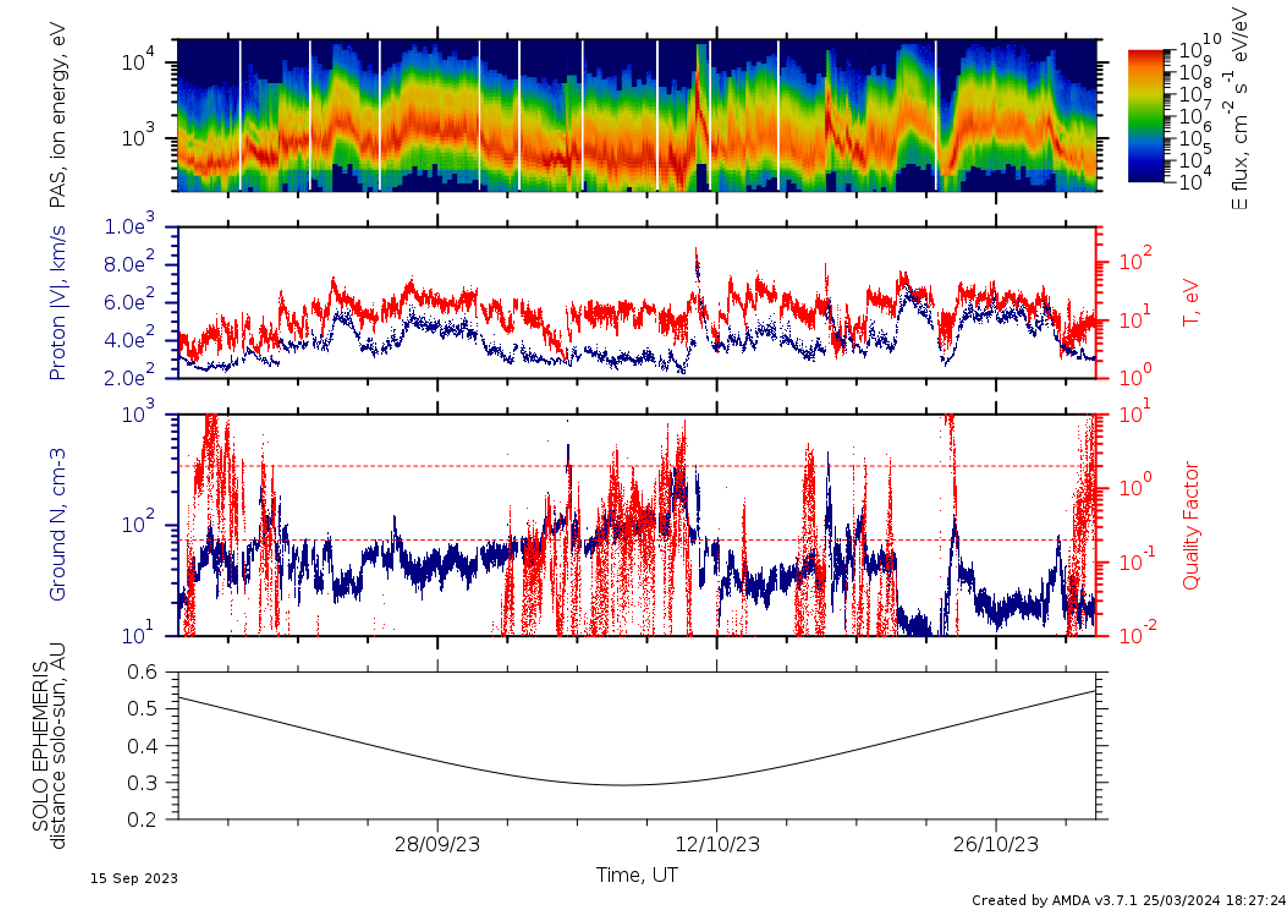
Figure 51. Mostly slow-intermediate speed wind with a few ICMEs. PAS static mode (window changes every 6h, 4s cadence). Distance 0.29 AU.
ICMEs on the 4th of Sep 2023
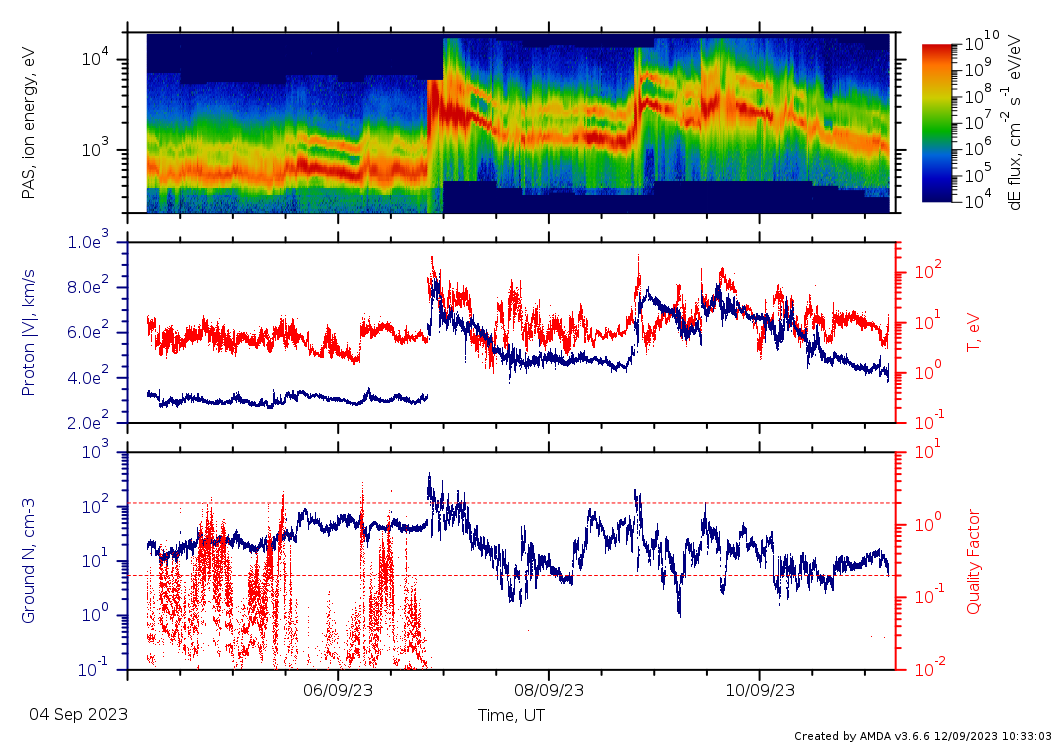
Figure 52. Possibly two ICMEs. 1st shock with \Delta V = 500 km/s, 2nd shock with \Delta V = 300 km/s. The ion energy flux of the 1st shock overshoots the PAS field of view. Alternate intervals of hot and cold materials.
A high density interval with clear He2+ on the 21st August 2023
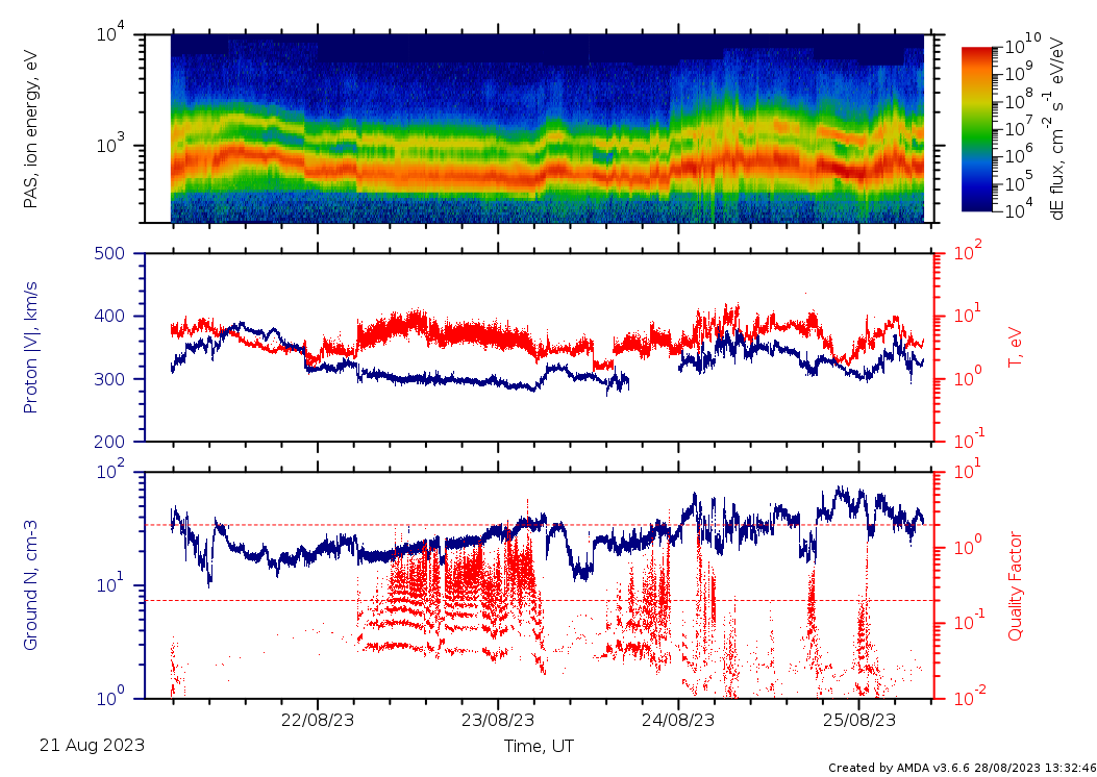
Figure 53. A high density interval with clear He2+ (and possibly another ionized species above He2+?).
Alternating hot/cold intervals with clear He2+ on the 18th of Aug 2023
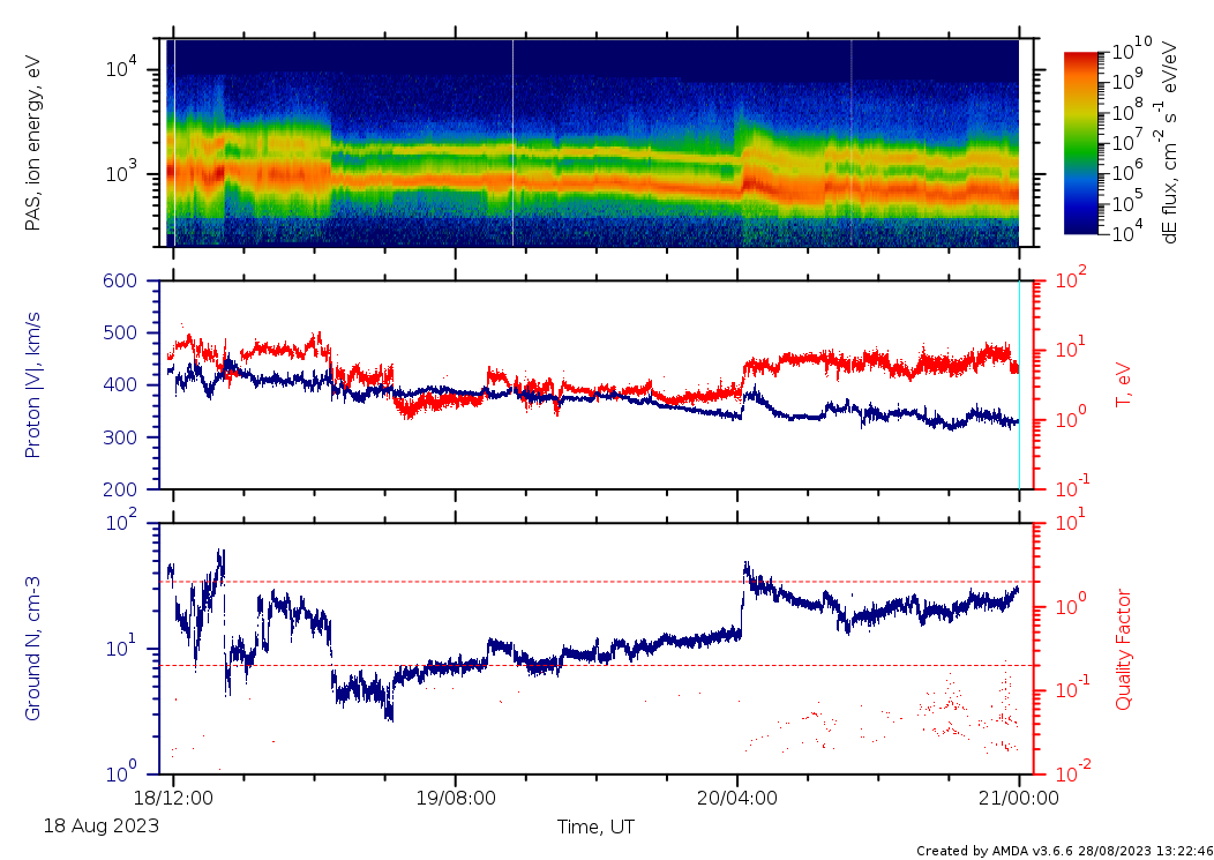
Figure 54. Alternating hot/cold intervals with clear He2+. There is possibly an IP shock on 20th of August at 4:00.
An IP shock on the 10th of Aug 2023
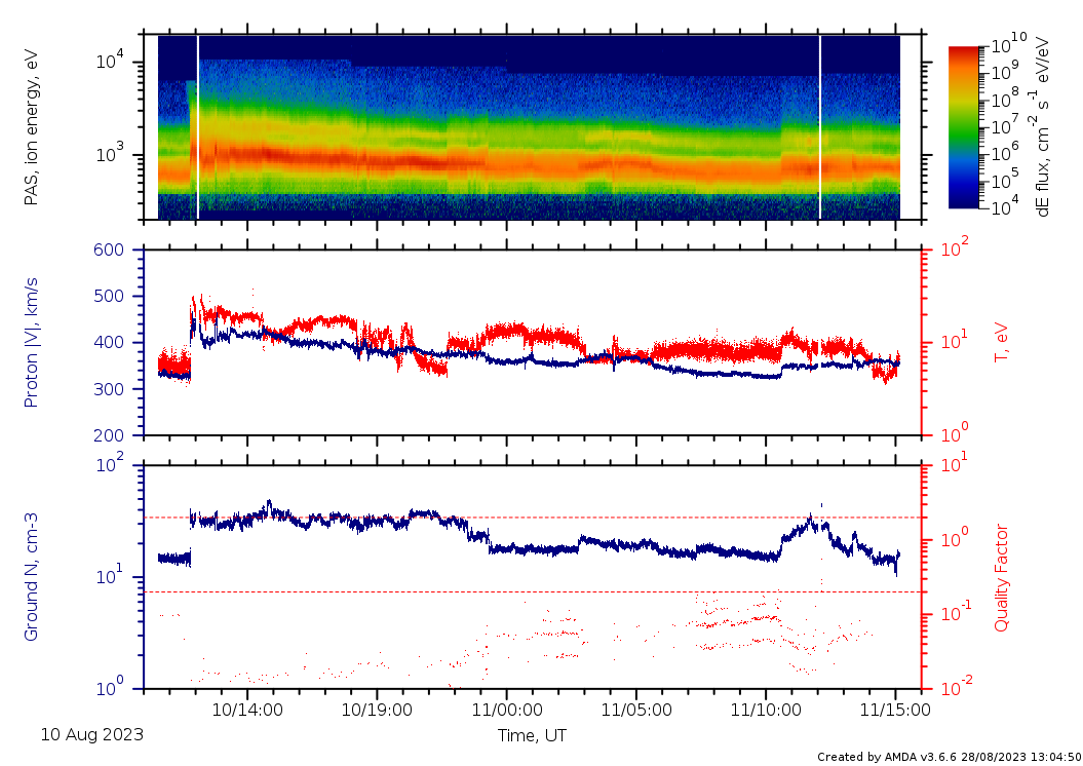
Figure 55. An IP shock, with some possible partial IP crossings.
An enhanced density interval on the 8th of Aug 2023
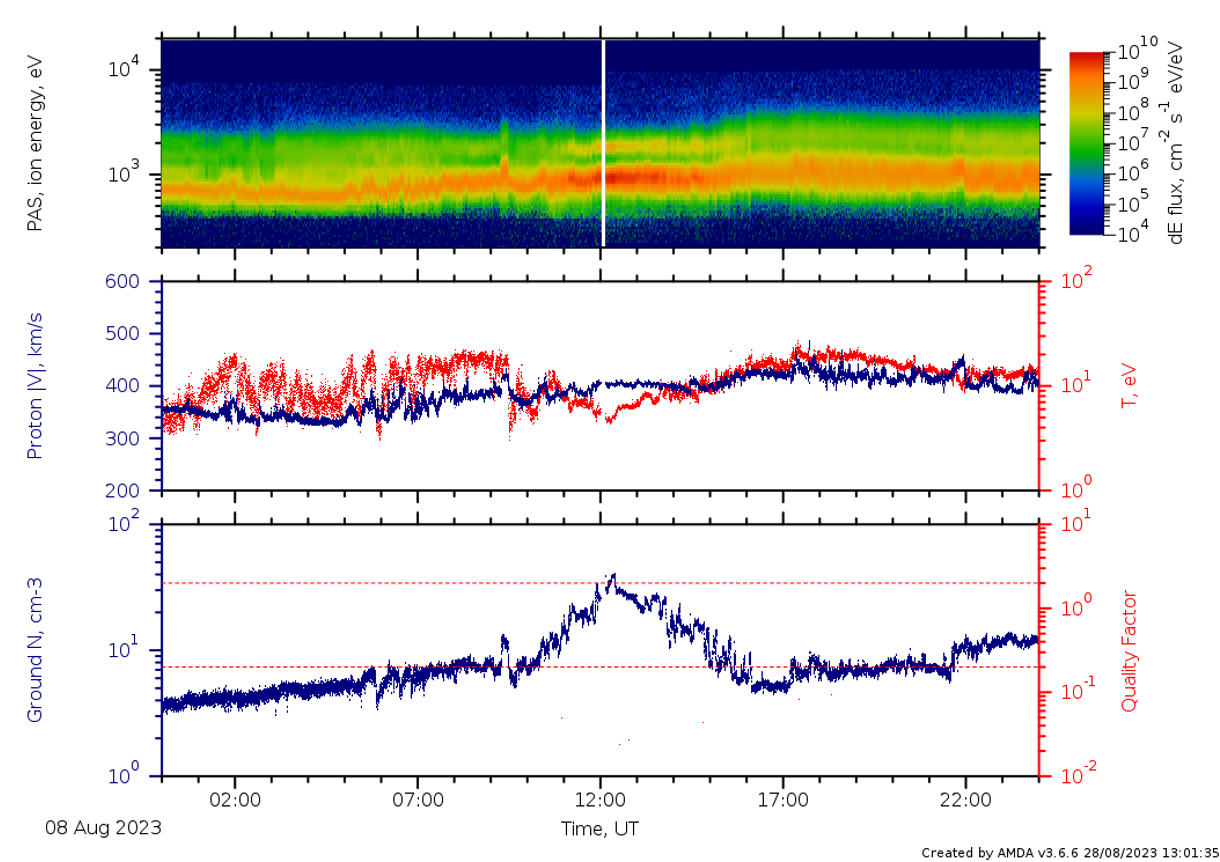
Figure 56. An interval with the ion density enhancement.
An IP shock on the 3rd of Aug 2023
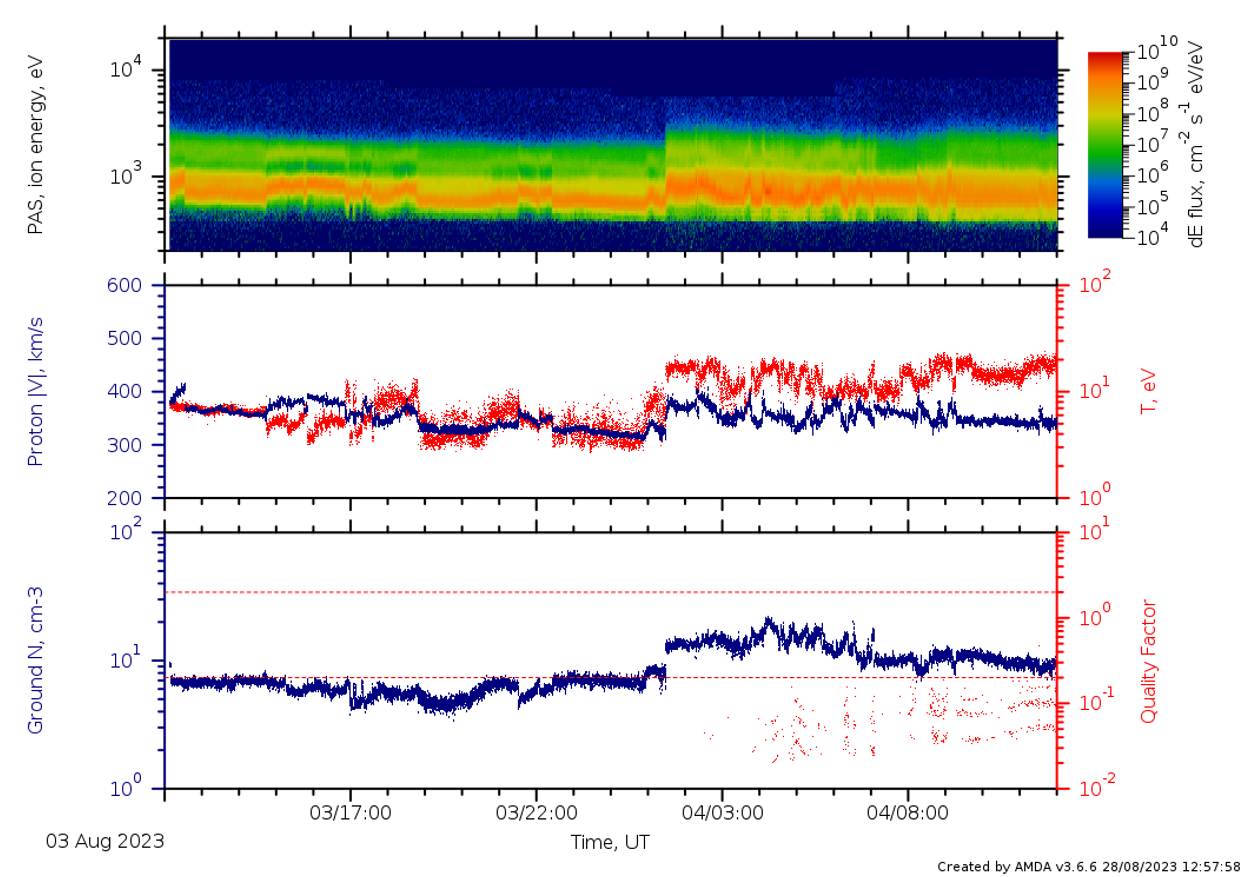
Figure 57. An interplanetary (IP) shock in the slow wind.
An ICME on the 26th of July 2023
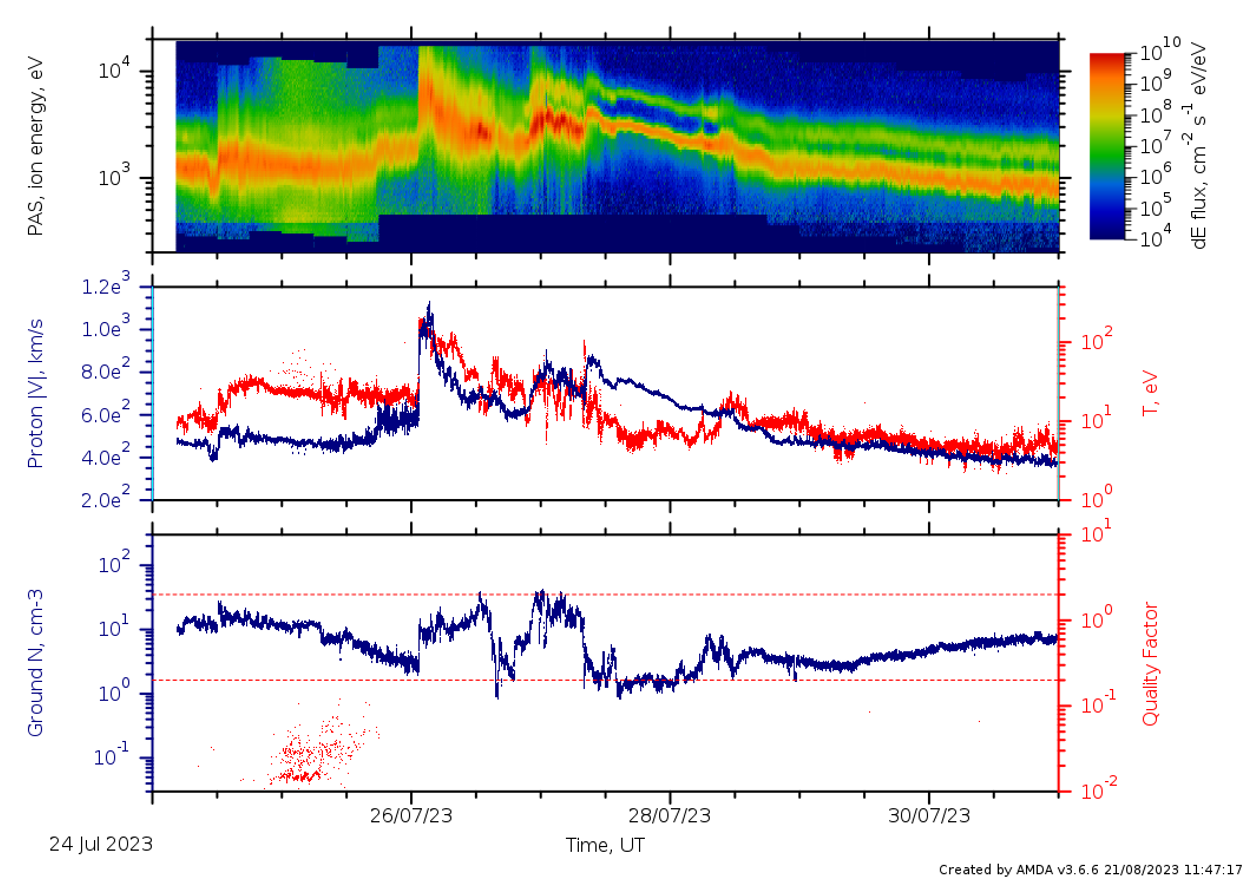
Figure 58. An ICME on the 26th of July with maximum proton speed of 1130 km/s. There are two intervals of fast and dense protons. A cold trailing interval after the 2nd speed bump. There are some contaminations possibly due to photoelectrons across all the energies before the shock.
An ICME on the 18th of July 2023
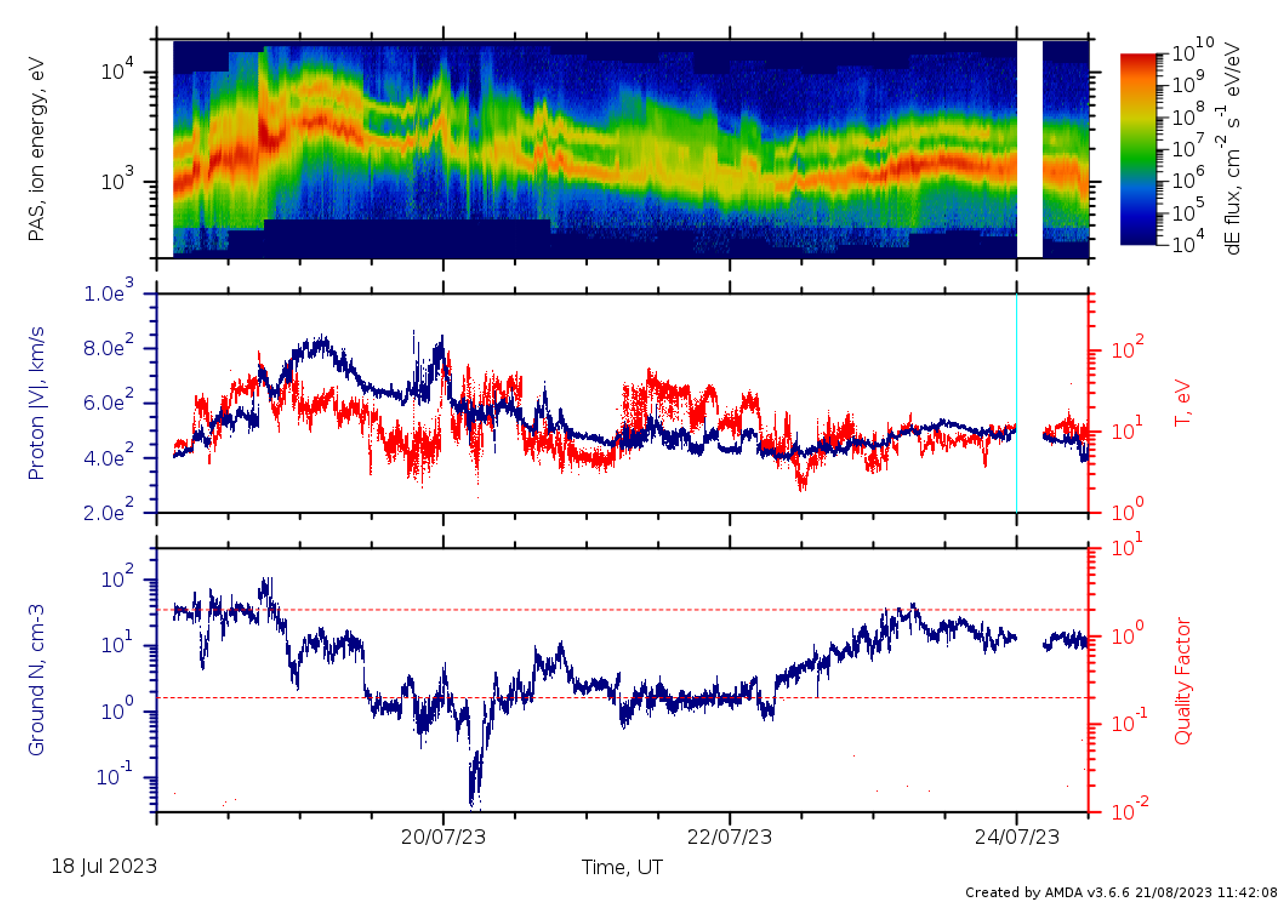
Figure 59. ICME with maximum proton speed of 800 km/s and intervals of cold H+ and He2+ (and some hot H+). A few hours interval with a very low density (0.02 cm-3).
An ICME on the 14th of July 2023
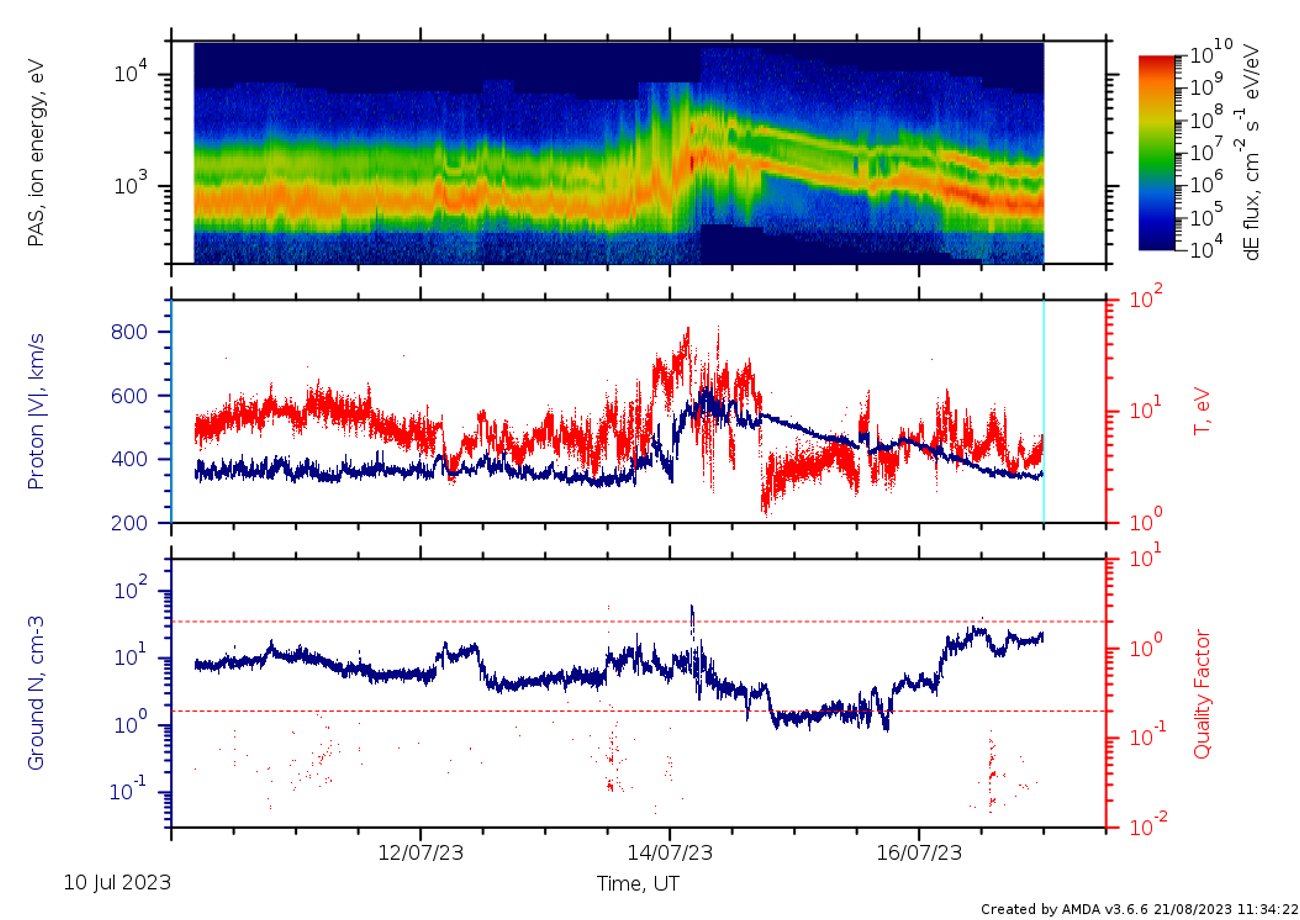
Figure 60. ICME with maximum proton speed of 600 km/s and cold trailing interval (with a second proton peak, possibly a very fast beam, above the first peak).
Cold then hot wind strems on the 26th of June 2023
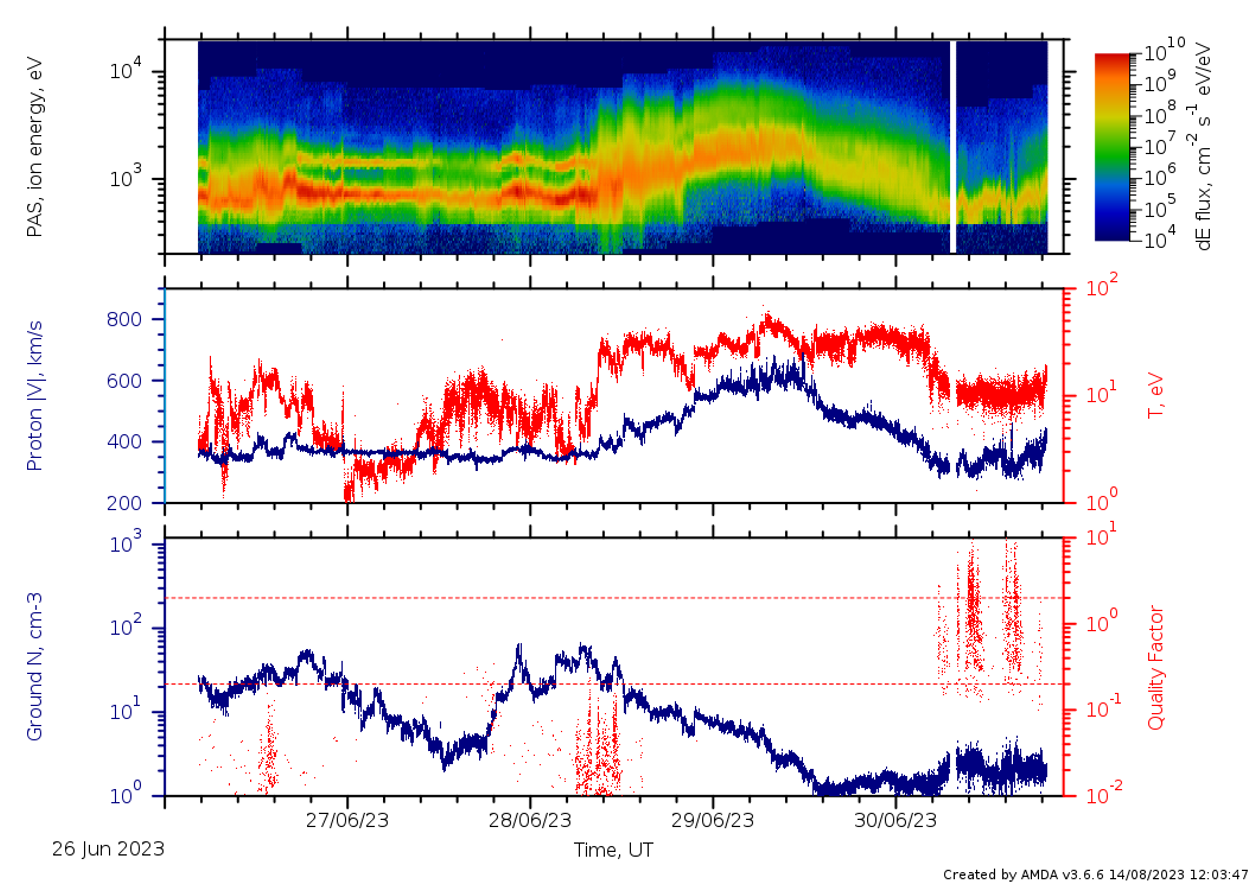
Figure 61. A hot ion stream with intermediate/high speed wind, preceded by an intermediate/slow wind interval with clear He2+.
Slow, hot wind on the 20th of June 2023
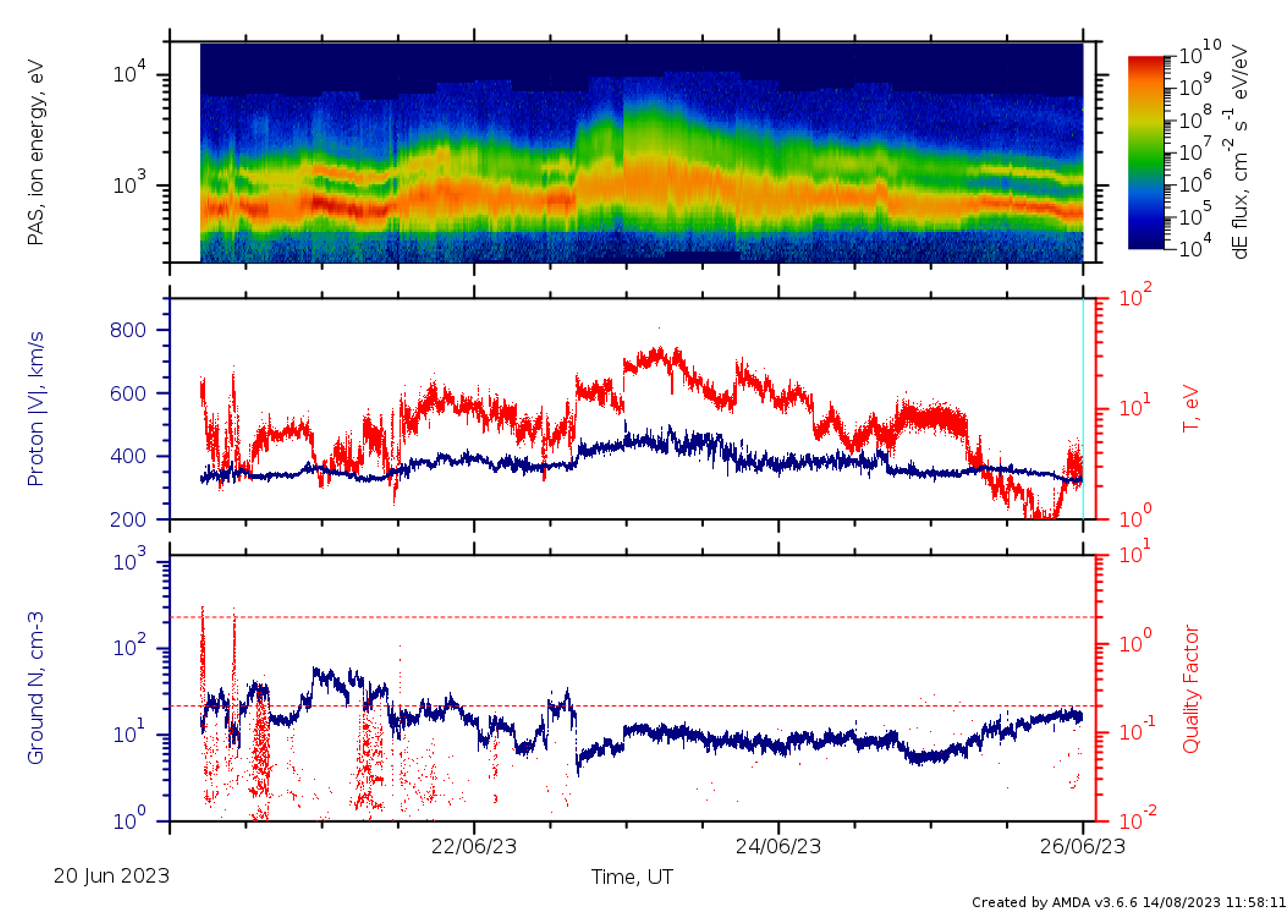
Figure 62. Slow, hot solar wind with some clear (dense) He2+.
Stream Interface on the 10th of June 2023
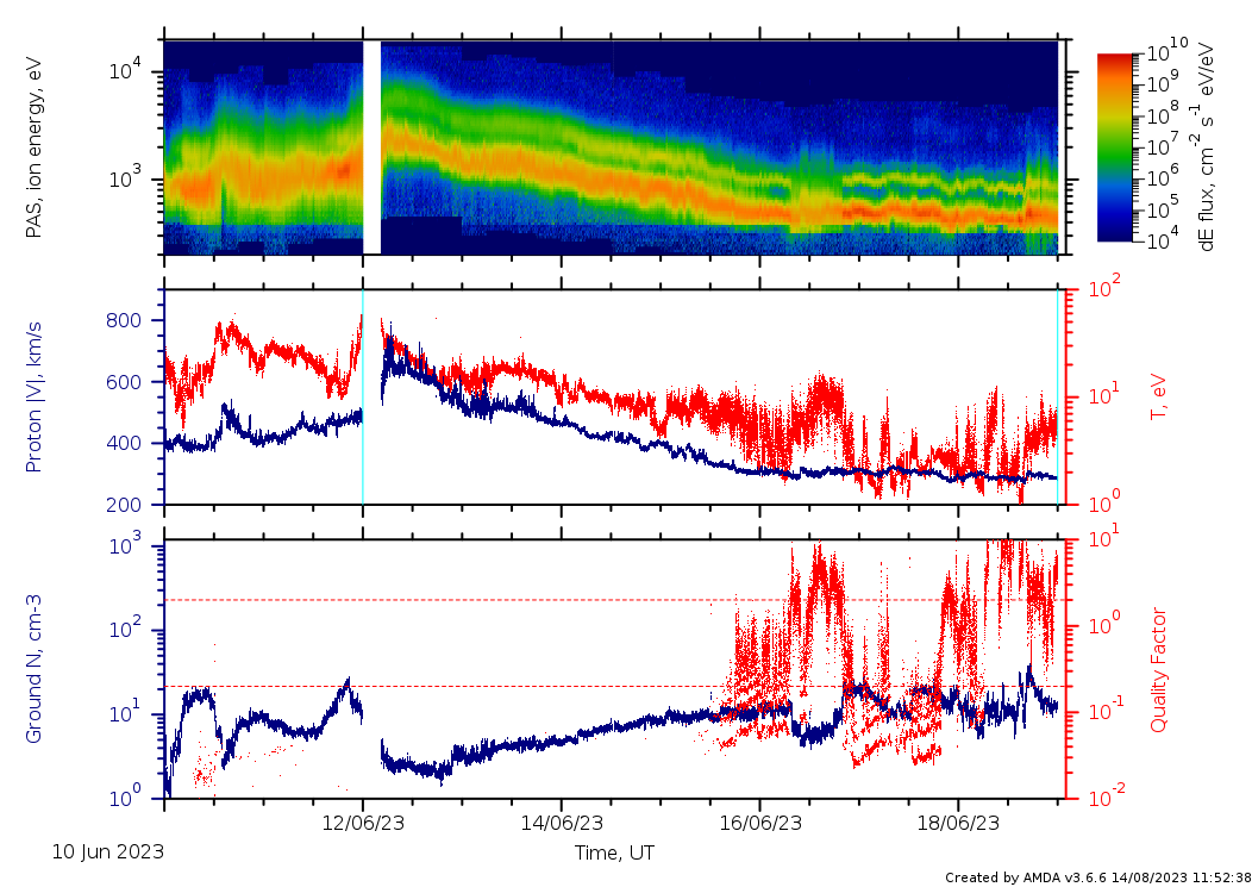
Figure 63. Stream interaction region with clear H+ and He2+ in the trailing part (slow wind).
Stream Interface on the 29th of May 2023
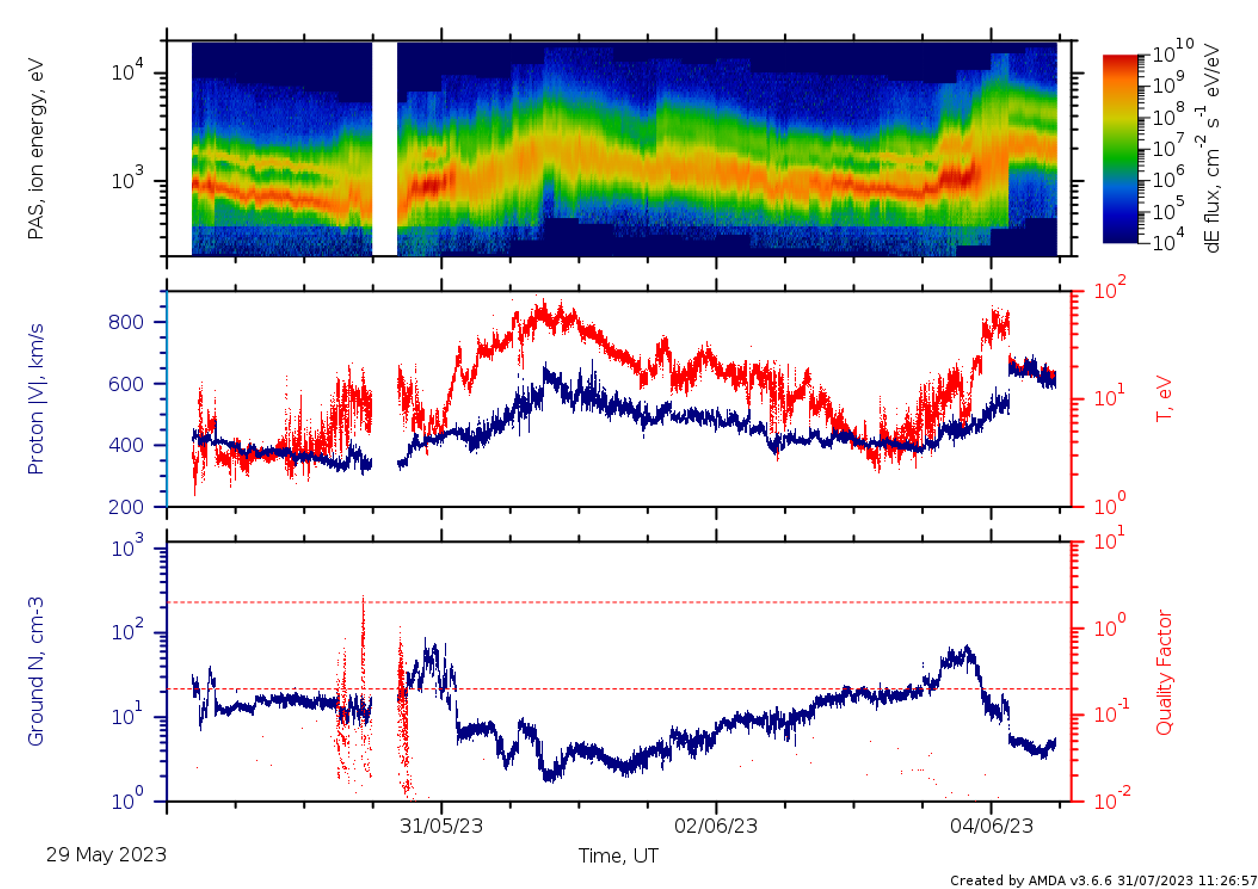
Figure 64. Cold stream of H+ and He2+ preceding hot stream (with a stream interface – like structure), followed by an ICME-like structure in intermediate – fast wind.
ICMEs on the 1st of May 2023
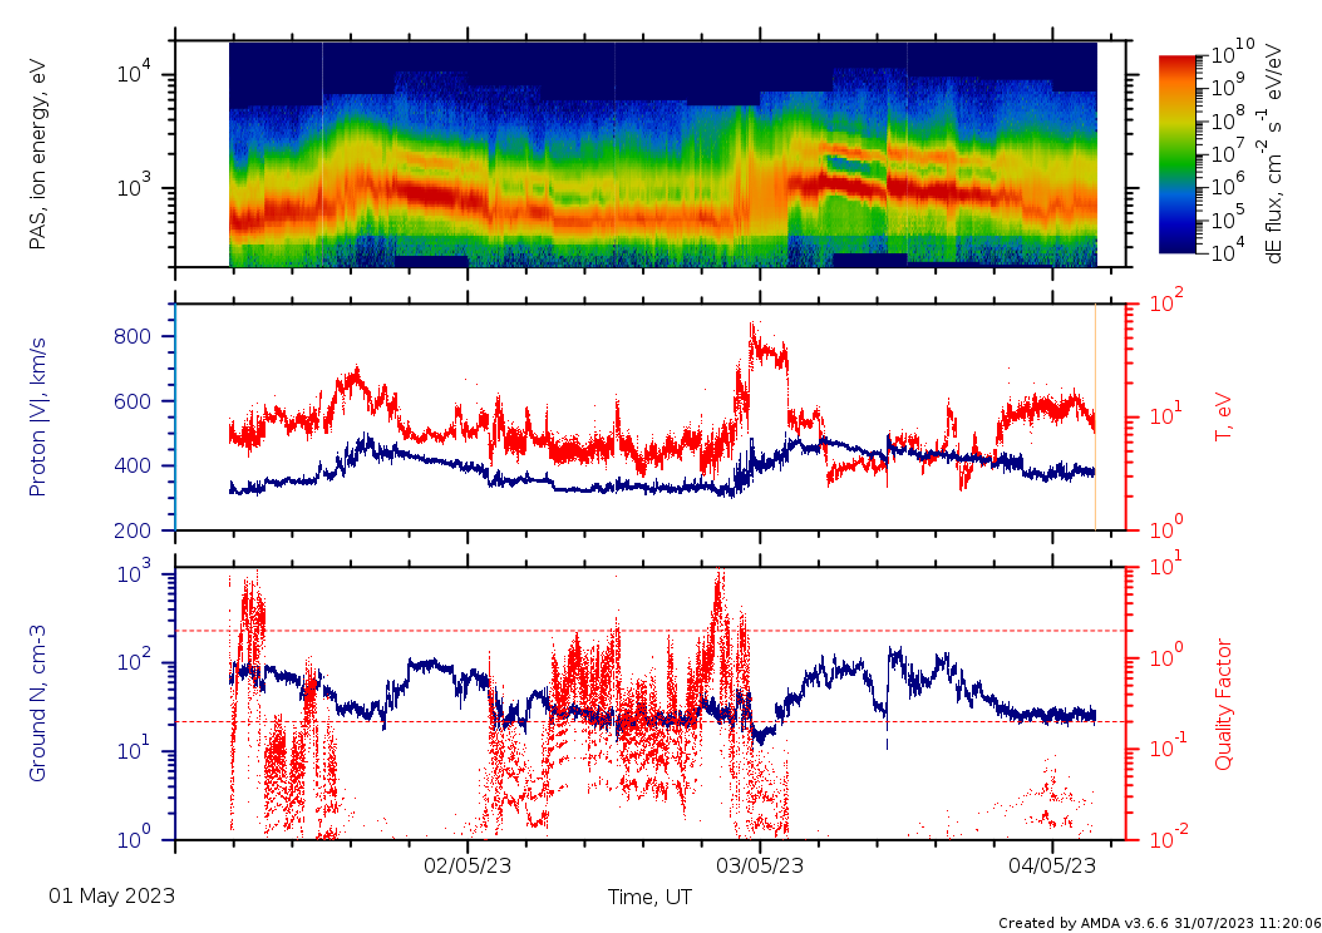
Figure 65. ICMEs in intermediate/slow wind with hot sheath and cold plasmas (0.5 AU).
A stream interface during the April 23 perihelion
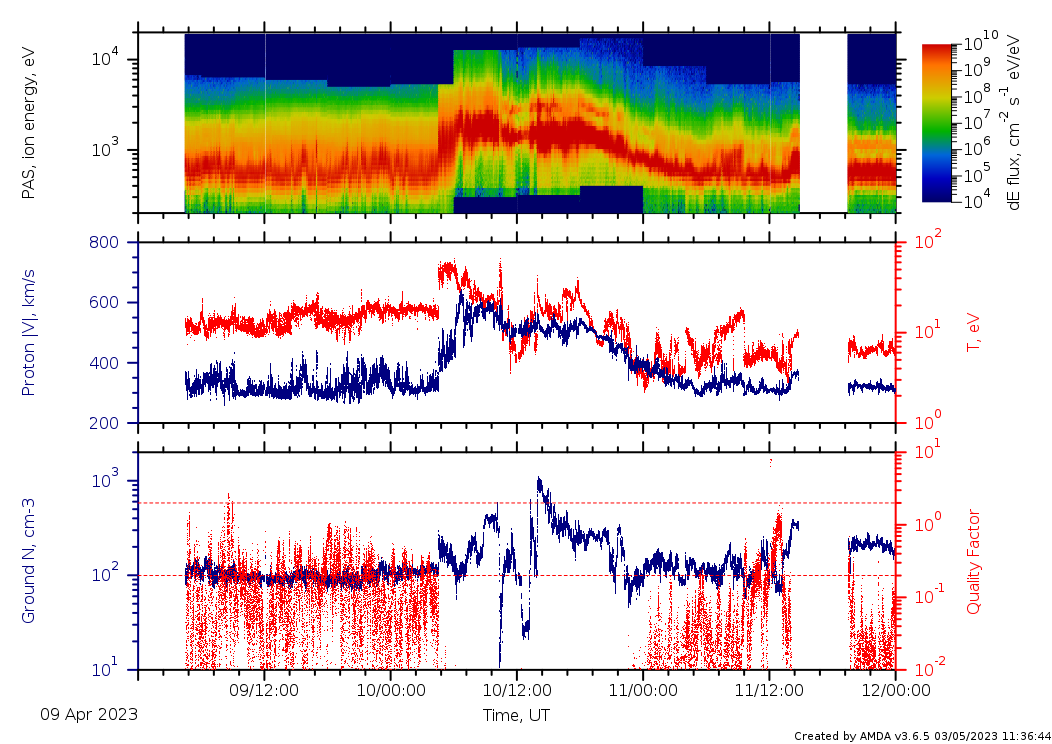
Figure 66. A stream interface observed at 0.29 AU during the perihelion. The fast stream has a very high number density, reaching 1500 /cc. There is an intense He2+ energy flux with a clear separation from the cold protons in the fast stream.
An ICME on the 20th of March 2023
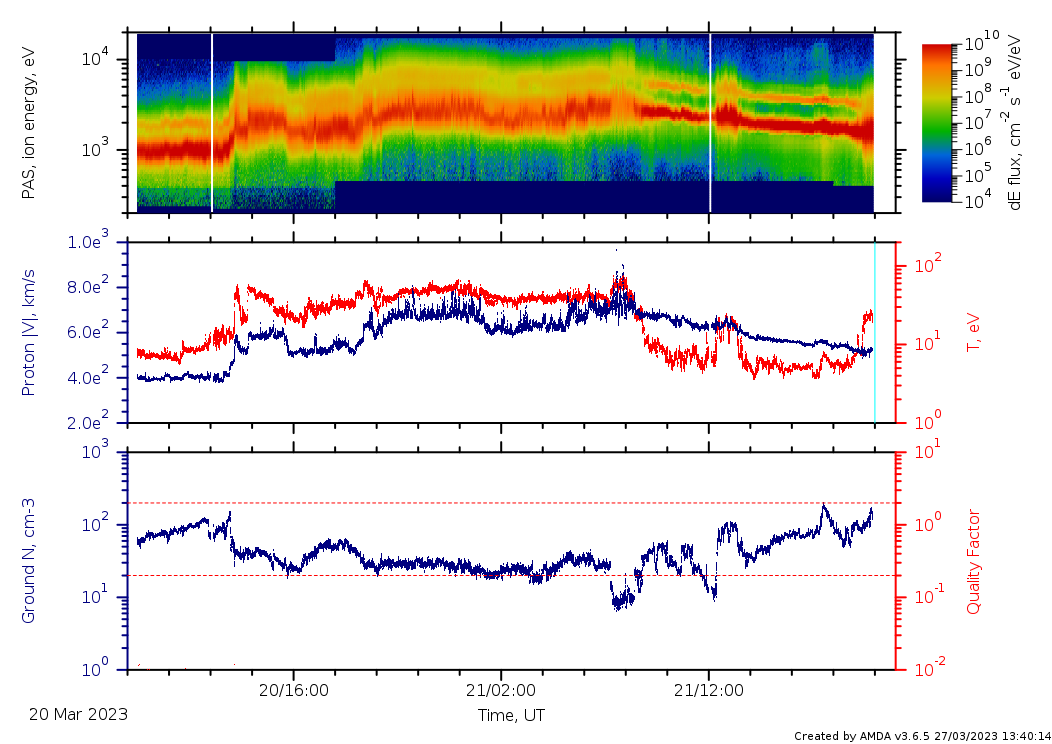
Figure 67. An ICME with shock on the 20th and a cold/dense plasma with clear proton-alpha separation in the trailing part. This event was observed to have a strong Bz and it arrives at Earth.
A shock on the 14th of March 2023
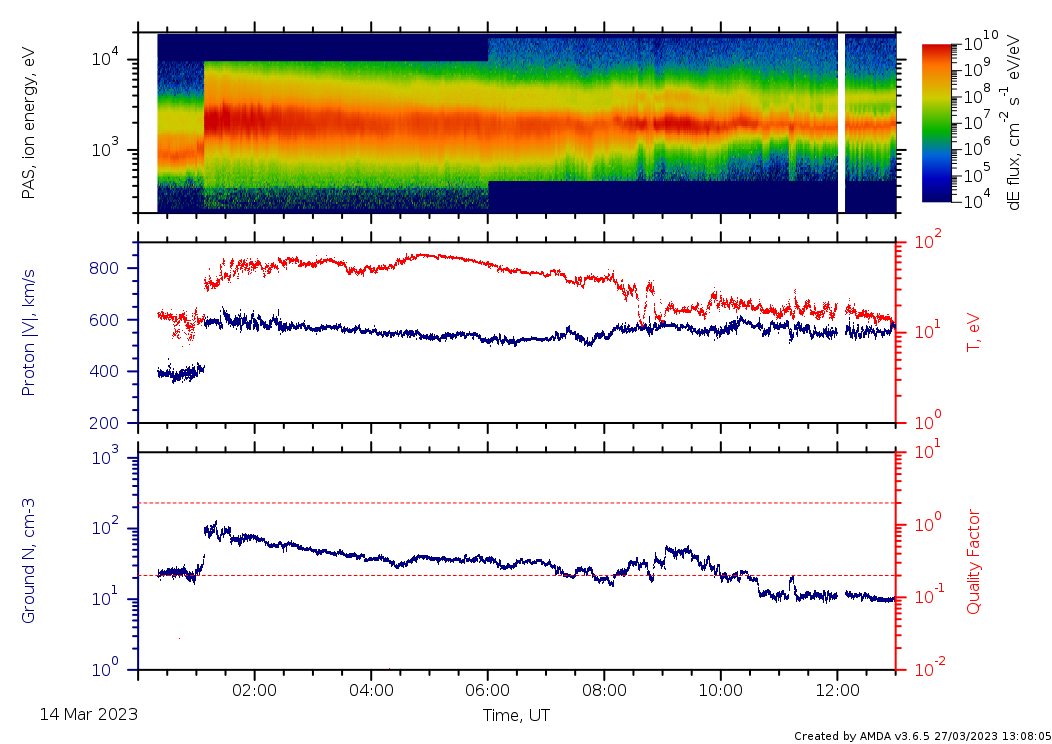
Figure 68. A shock arrival.
A shock and/or stream interface on the 19th Feb 2023
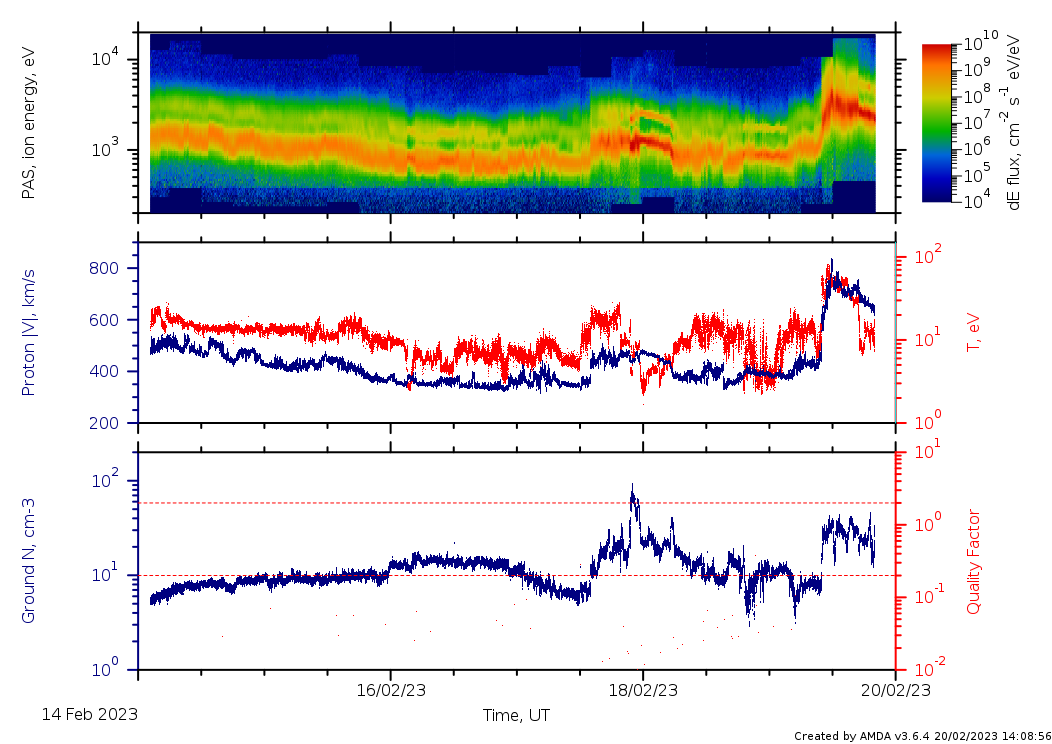
Figure 69. A shock and/or stream interface with preceded cold plasma.
An interplanetary shock on the 17th Jan 2023
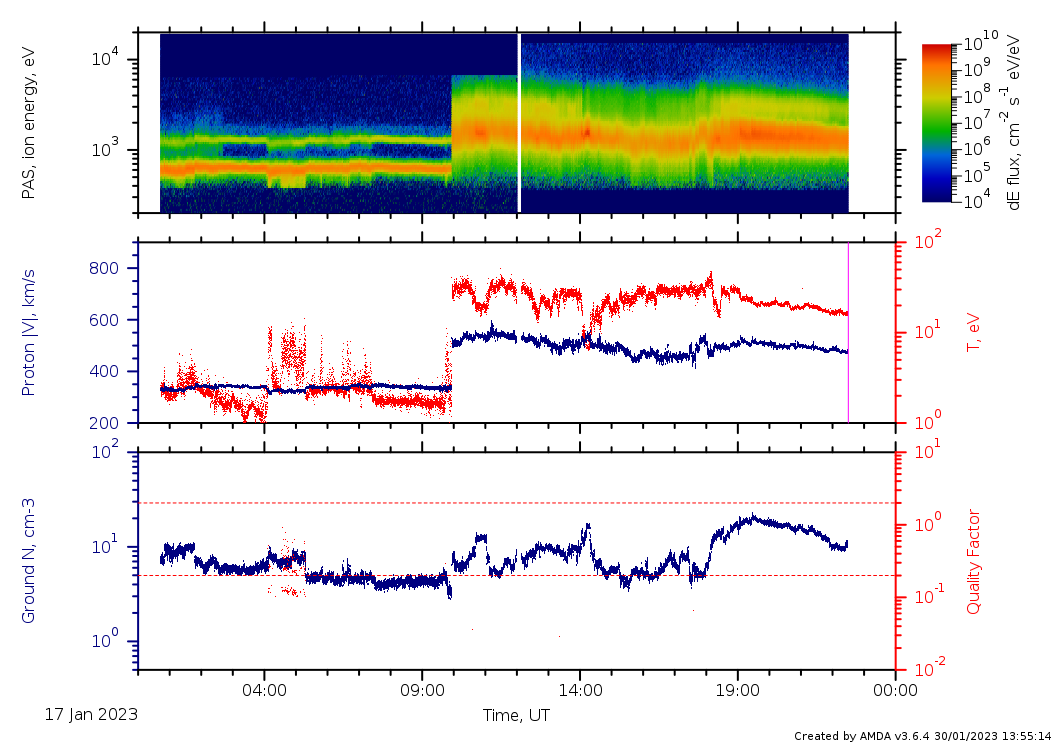
Figure 70. An interplanetary shock.
Possible ICME on 11th Jan 2023
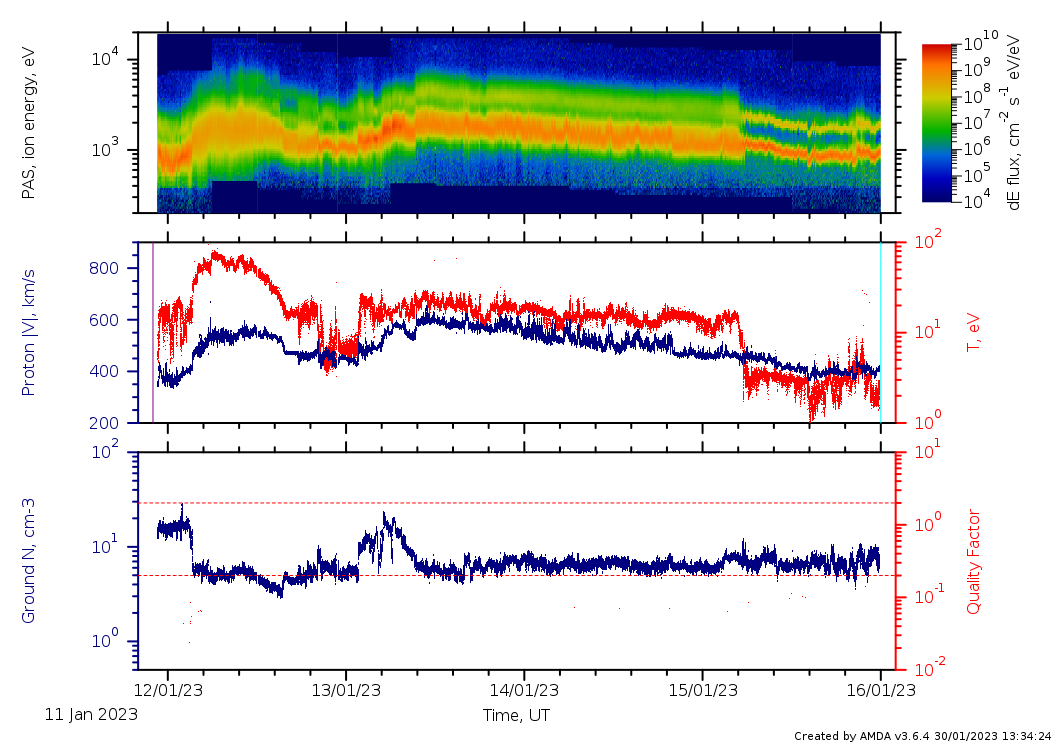
Figure 71. A potential Coronal Mass Ejection with a broaden shock region and a flux-rope structure at the trailing edge.
Ion density dropout (also observed by MMS on 25/12/2022)
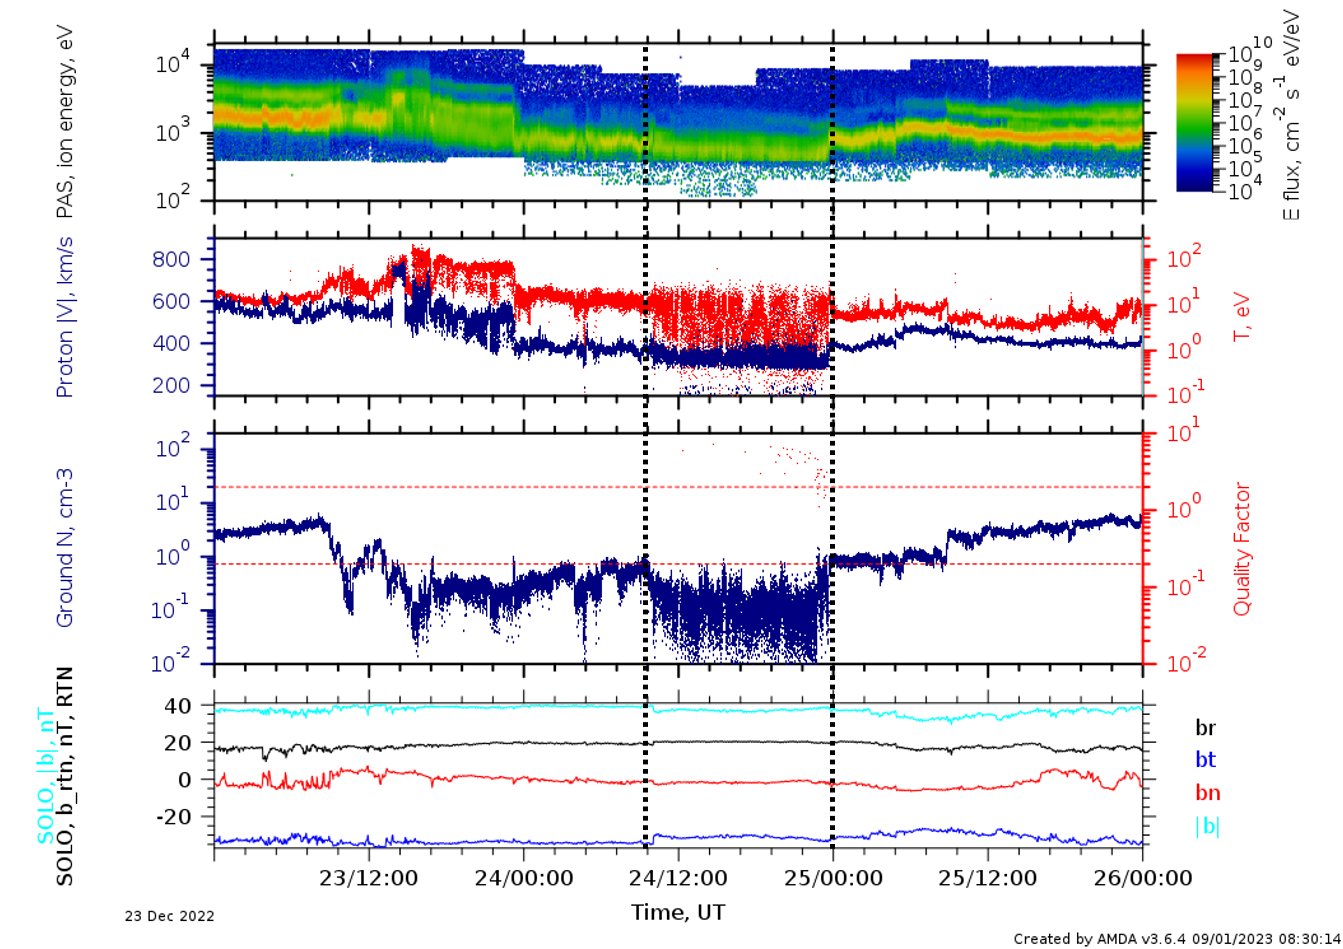
Figure 72. A drop of ion omnidirectional energy flux on the 24th December 2022, characterised by a 12-hr interval of a very low ion Eflux with n ~ 0.01 - 0.1 cm-3. Likely high uncertainties for moment calculations, seen as strong fluctuations of temperature and ion number density. SolO was located before Earth/MMS. Stereo-A was between SolO and Earth.
Perihelion Oct 2022 (0.29 AU) plausibly featured by switchback patches
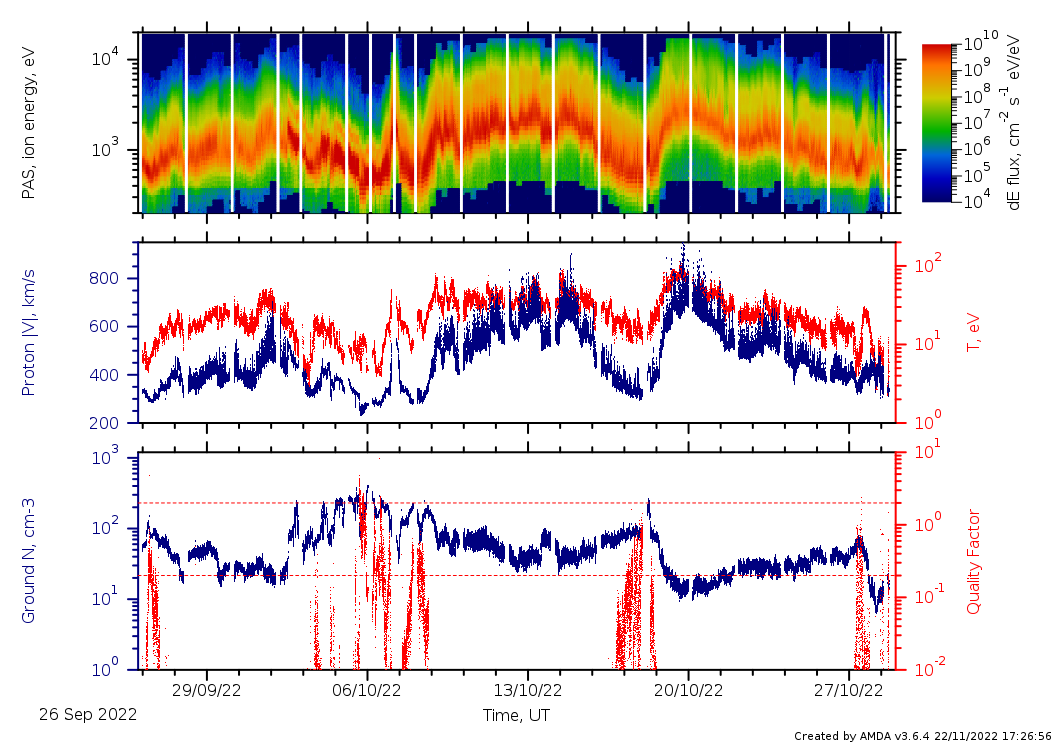
Figure 73. Slow and dense solar wind at 0.33 AU and high-speed streams plausibly containing switchback patches at 0.3 AU.
Shock/ICME on 6th September 2022
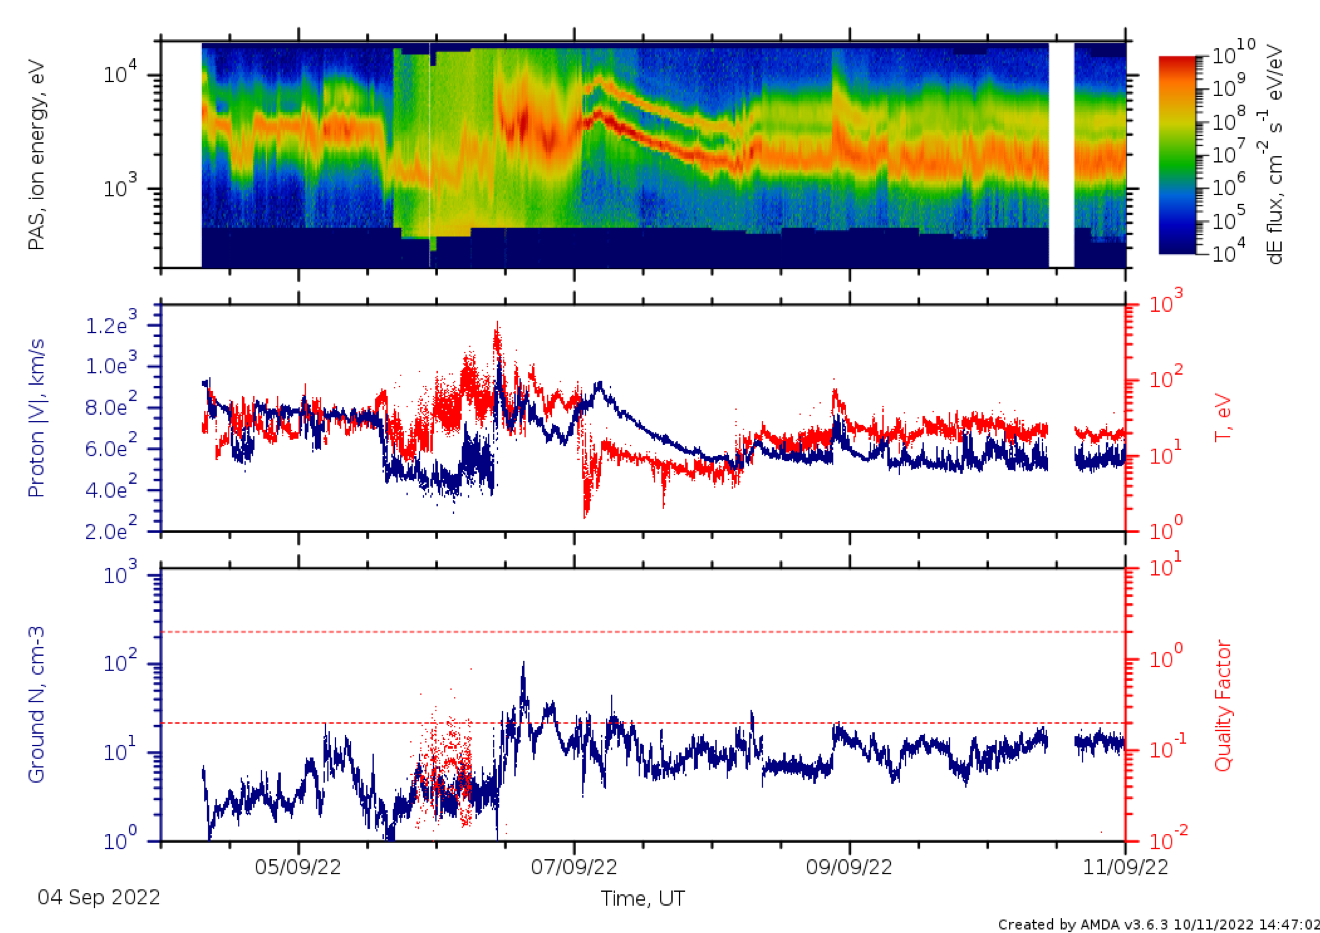
Figure 74. A shock/ICME arrival on the 6th of September 2022. High-speed protons up to 1100 km/s and high-temperature protons up to a few hundred eV in the shock. Cold protons in the magnetic cloud.
SIR/HSS or ICME on 3rd September 2022
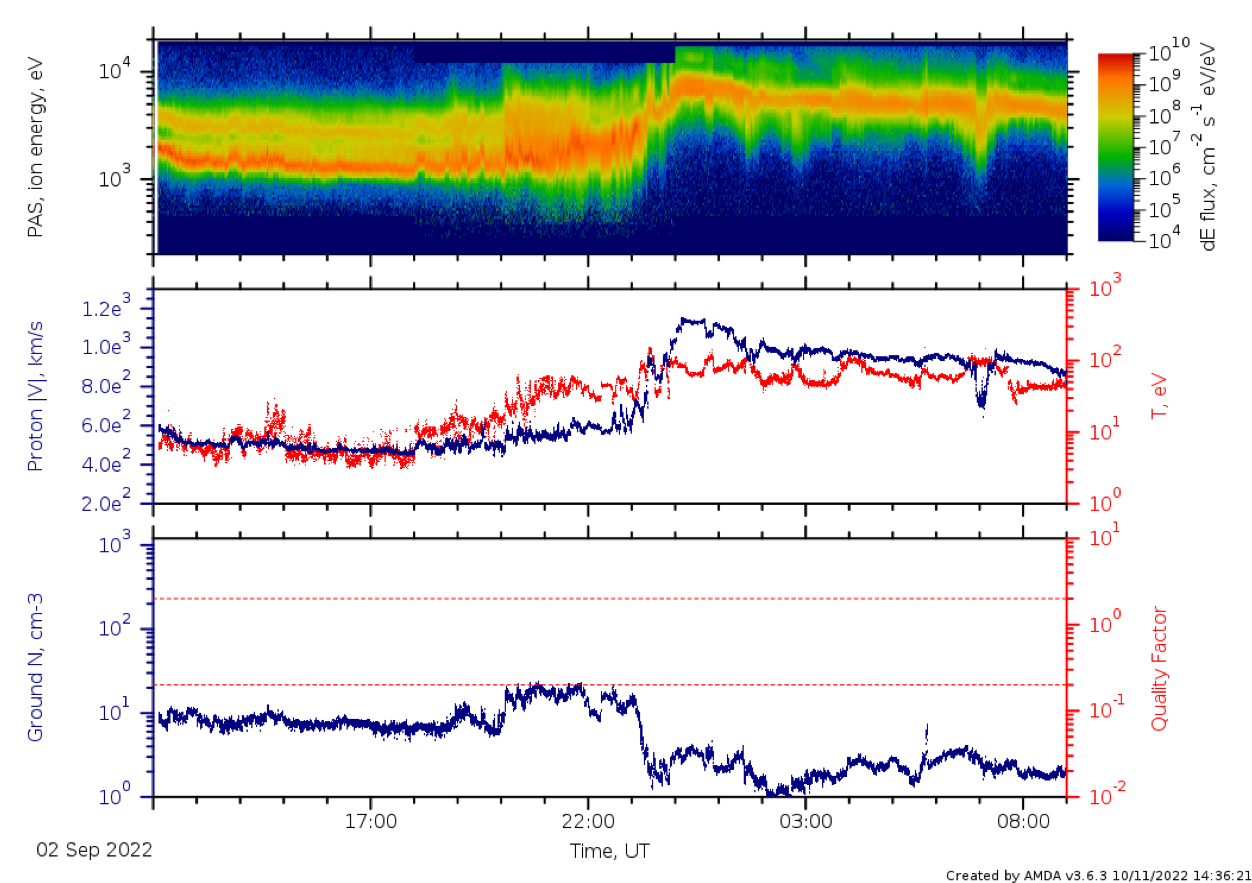
Figure 75. A stream interaction region / high-speed stream or an ICME arrival on the 3rd of September, 2022.
Shock/ICME on 1st September 2022
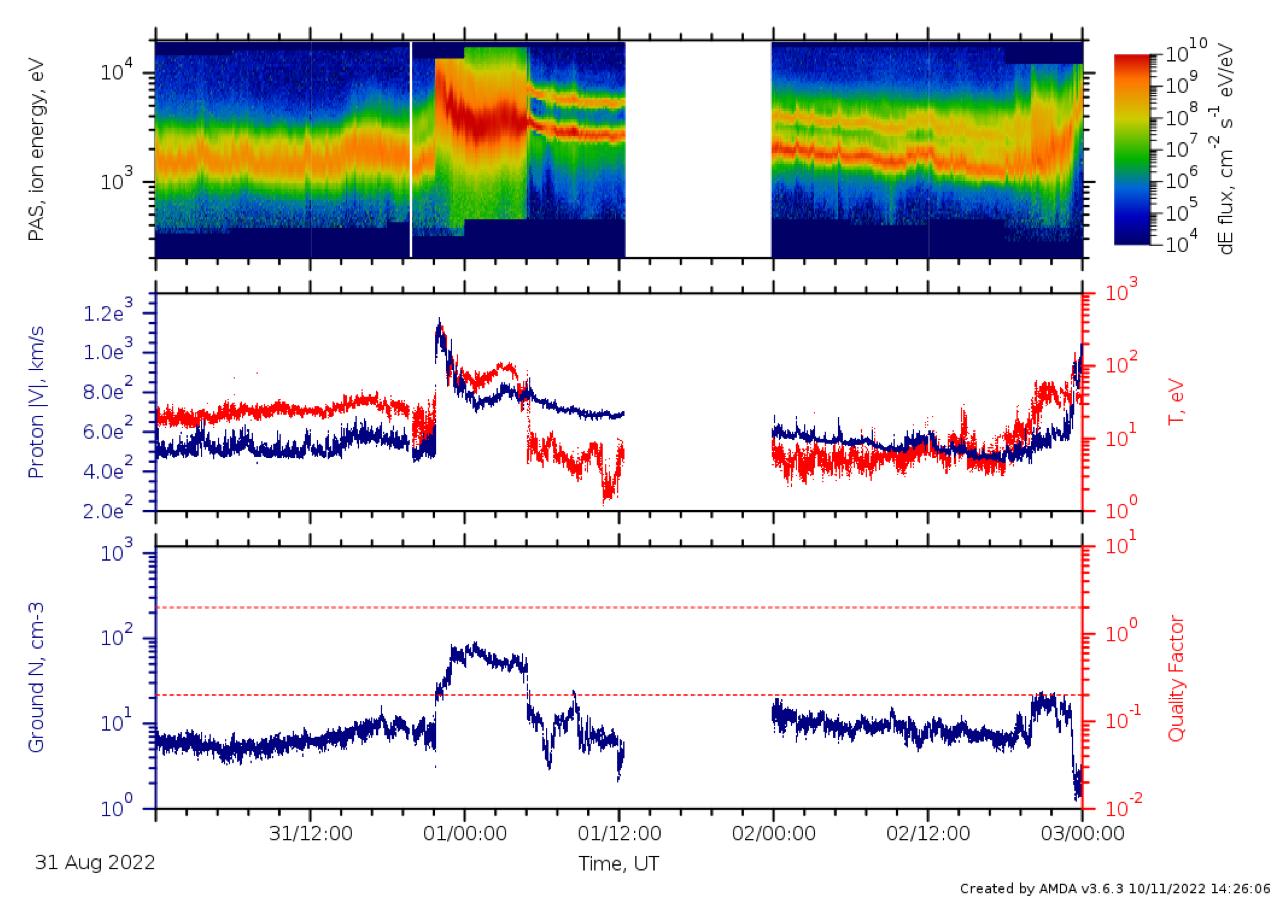
Figure 76. An ICME detected on the 1st of September 2022. Proton speed up to 1200 km/s in the shock. Cold plasma in the magnetic cloud. Data gap at the beginning STP 220, starting from 12:35 due to WOL and TCM.
Interplanetary shock on 17/06/2022
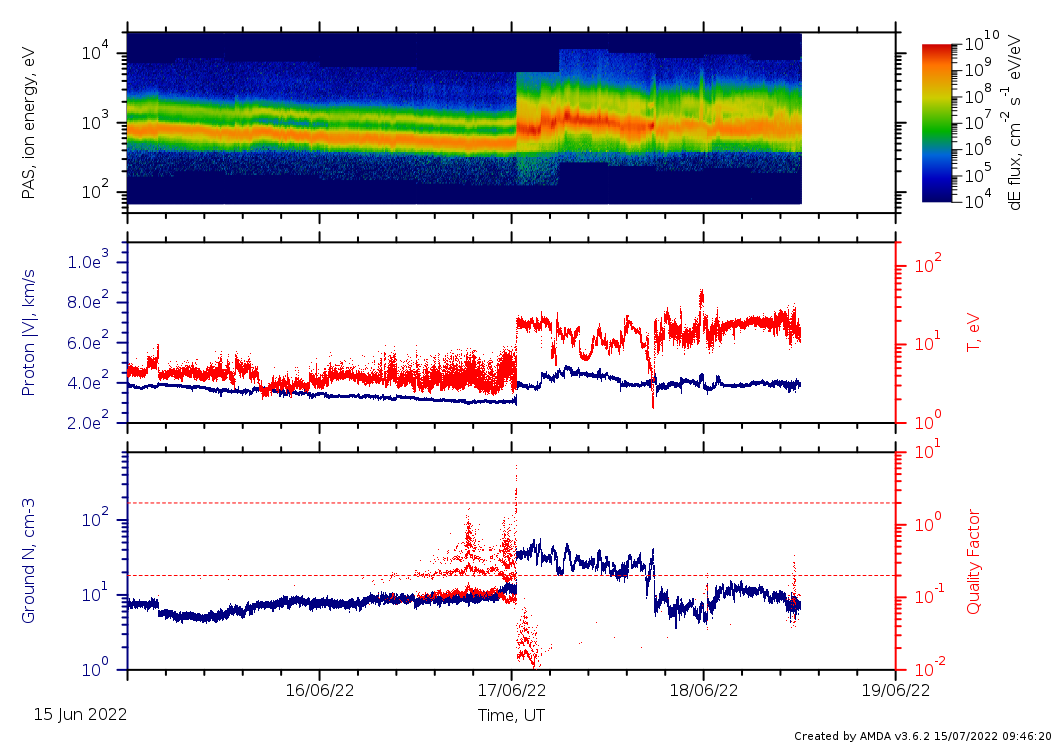
Figure 77. Interplanetary shock. Warning - data quality factor exceeding the lower threshold before IP shock.
Shock/ICME on 25/07/2022
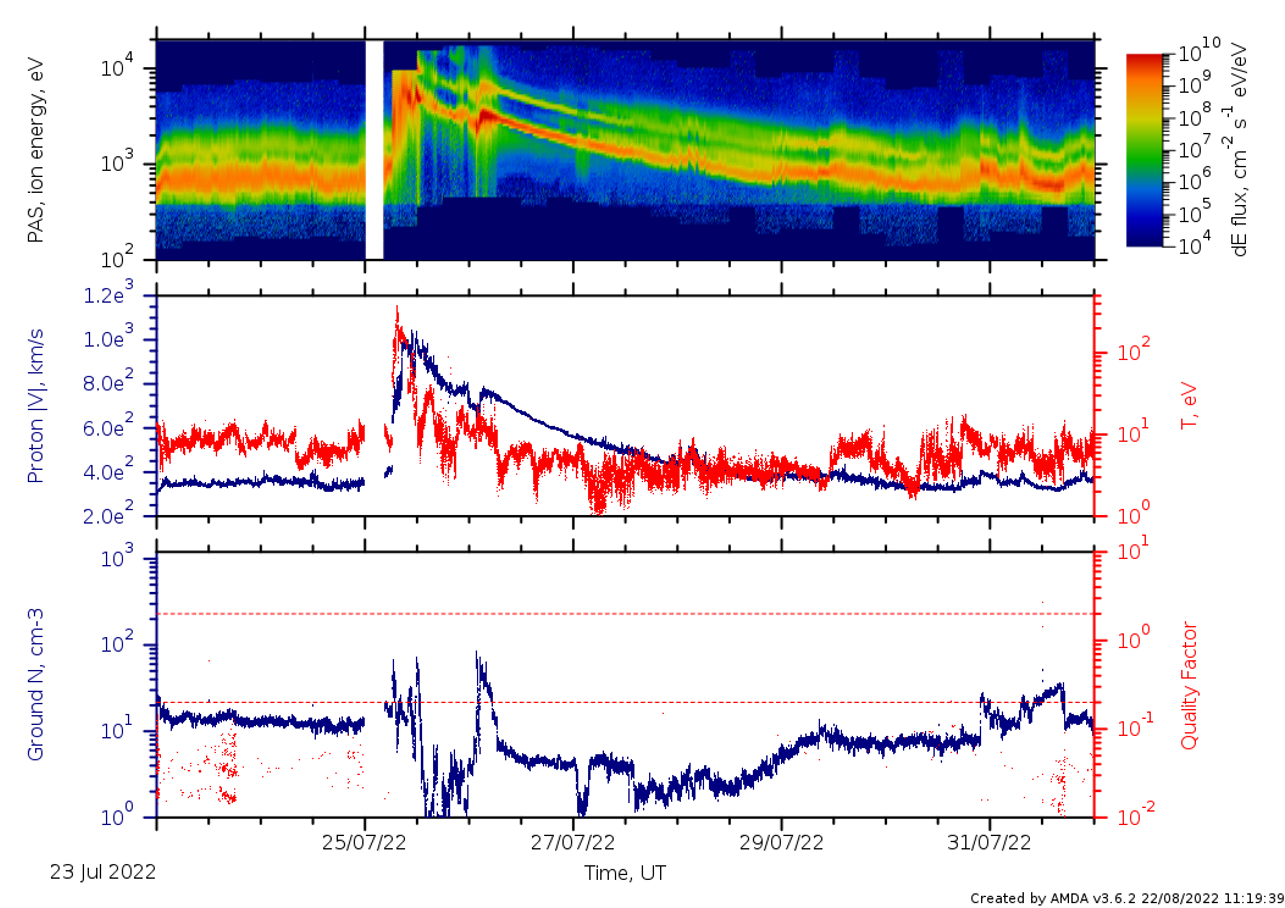
Figure 78. Shock/ICME arrival on 25/07/2022 with the proton bulk reaching ~1000 km/s.