1. Real-time operation
All operations have to be run with a dedicated Linux username : solar
1.1. Telemetry download
Open a new terminal [Application] ⇒ [Outils systemes] ⇒ [MATE terminal]
The next command will connect to IABG telemetry server and download data.
$ GET_TM_RT yyyy-mm-dd [hh:mm:ss]You can specify here:
-
an unique date, like yyyy-mm-dd
-
a date and a start time, like hh:mm:ss
|
|
Take care of entering two digits for both month, day, hour, min and seconds, and 4 digits for the year
|
$ GET_TM_RT 2018-11-29That will create a L0 binary file, containing all SWA TM packets :
/DATA/SOLAR/DATA/L0/20181129/solo_L0_swa-pas-tm_20181129.binSame procedure, but starting at a given time
$ GET_TM_RT 2018-11-29 09:15:00Telemetry packets will be added continuously at the end of the binary file, as long as the GET_TM_RT script is not stopped.
1.2. L1 data reprocessing loop
Open a new terminal [Application] ⇒ [Outils systemes] ⇒ [MATE terminal]
$ RUN_RT yyyy-mm-ddThis command will launch a bash script, that enter in an infinite loop, producing PAS L1 data, then wating some seconds and restart.
You have to set the date of the day corresponding to the data.
$ RUN_RT 2018-11-29Data will be generated in :
/DATA/SOLAR/DATA/L1/20181129/1.3. PAS data visualisation
Open a new terminal [Application] ⇒ [Outils systemes] ⇒ [MATE terminal]
$ clThis command will launch IRAP’s vizualisation tool (cl).
Ignore the first selection window, "General" by clickiing on [OK] or [Cancel]
Then open a dedicated view : [ Filee] ⇒ [Open…]
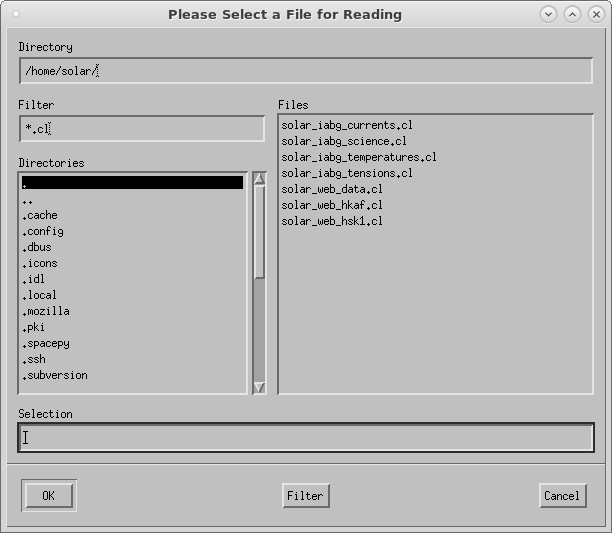
You can change the directory were .cl files are located, default is:
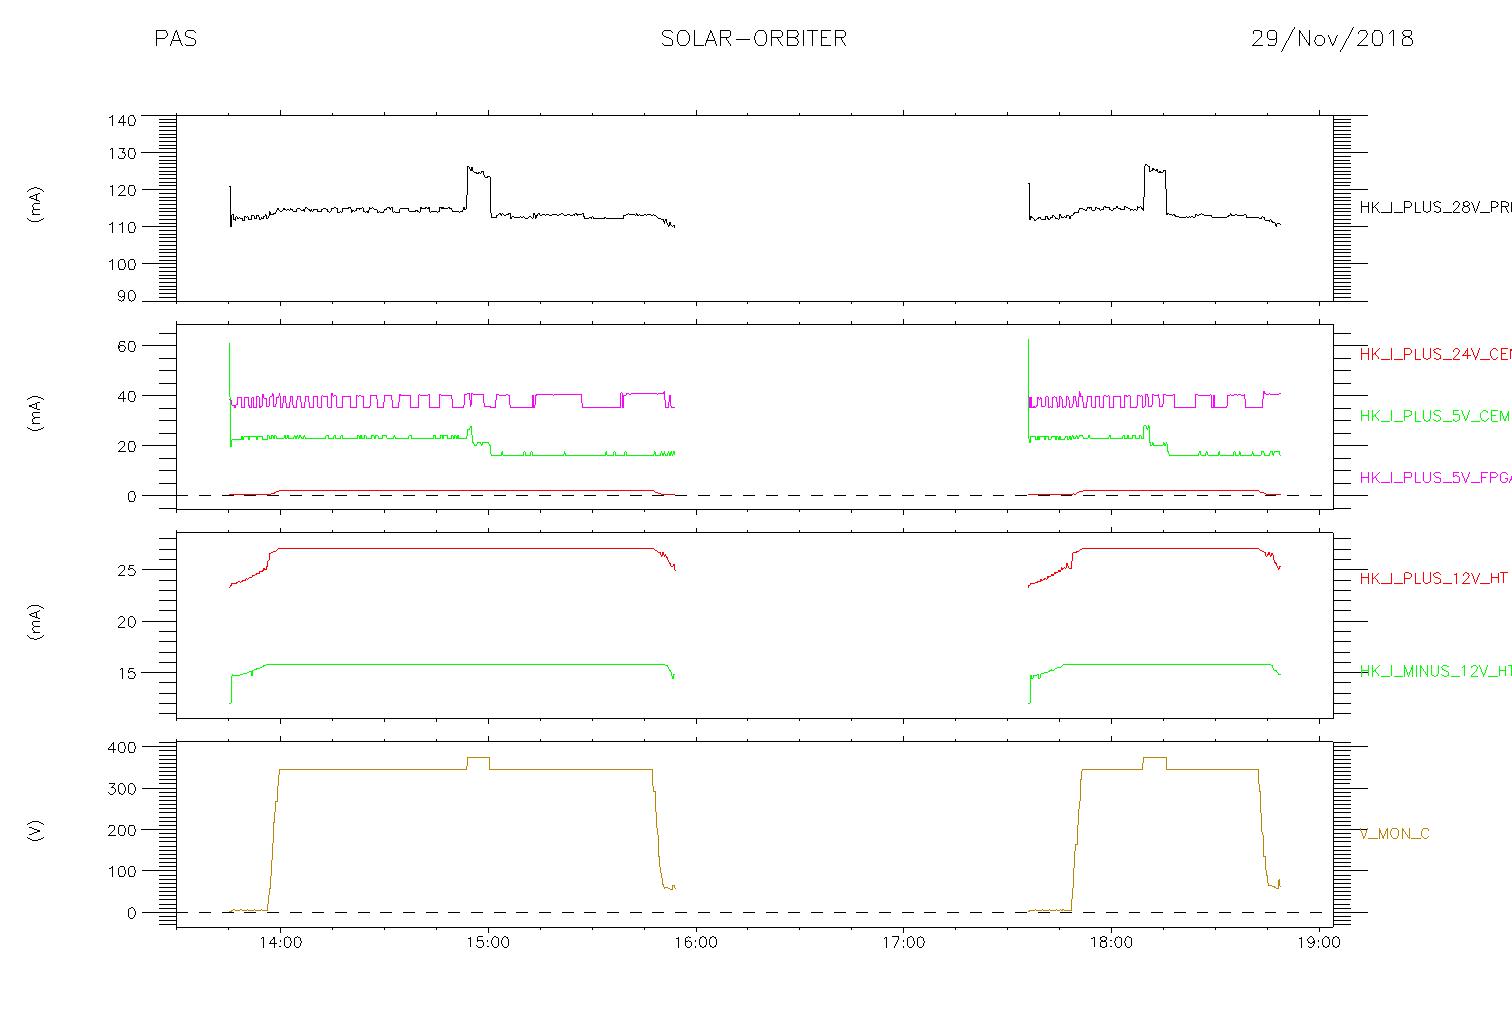
Directory : /home/solarYou can then select presiously generated CL view (*.cl), for example:
/home/solar/solar_iagb_currents.clThen click [OK] or press [Return]
2. Useful commands
2.1. Display SWA telecommands
This command will display the list of SWA TC for a given day.
$ SWA_TC yyyy-mm-dd$ SWA_TC 2018-11-21Each line contains :
-
TC acceptation date and status (OK/ERR)
-
TC execution date and status (OK/ERR)
-
TC parameters length (bytes)
-
TC indentification (service type, service sub-type)
-
TC name (SCOS database)
-
TC name
Then, you could find some statistics :
-
number of TC
-
number of TARF : TC Acceptation Request Failure
-
number of TECF : TC Execution Completion Failure
-
number un-acked : number of not acked commands
2.2. Display data processing log informations
$ SWA_LOG yyyy-mm-dd2.3. Display data processing errors (and/or warnings)
$ SWA_ERR yyyy-mm-dd
$ SWA_ERR -w yyyy-mm-dd2.4. Display data processing statistics
$ STATS yyyy-mm-dd

$ STATS 2018-11-21
This command display various statistics :
-
number of TC commands and TM packets by APID
-
number of TM packets for each SID
-
number of record for each CDF L1 file