I could reprocess data for 2019/06/25, after mixing L0 TM files sent by MSSL :
PAS_decomp_test_25062019/PAS_COMP_CA.bin

PAS_decomp_test_25062019/PAS_NM3D_Science_DeCompressed.bin-
The first one contains both PAS HK, TCs, Science Raw data and compressed data (SID=195)
-
The second one, generated by Chandra, contains uncompressed PAS data (SID = 195) and corresponding descriptors (SID = 194)
I started to create a new L0 file, by filtering out compressed data (SID = 194,195) from PAS_COMP_CA.bin
Then I could concatenate PAS_NM3D_Science_DeCompressed.bin to the previous one.
I finally reprocess the new L0 binaty file.
You can see the result for the whole day at run=view&date=2019-06-25
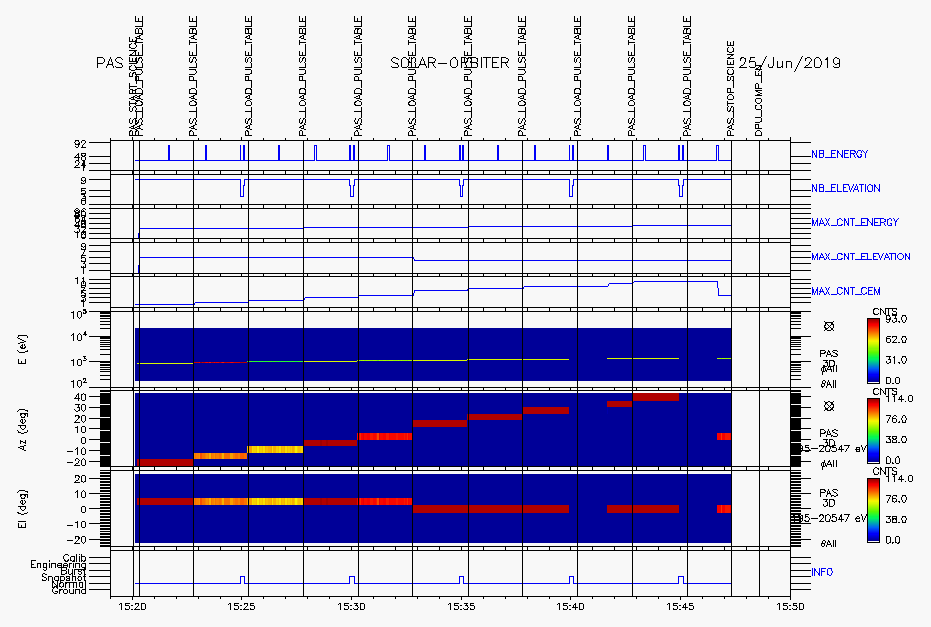
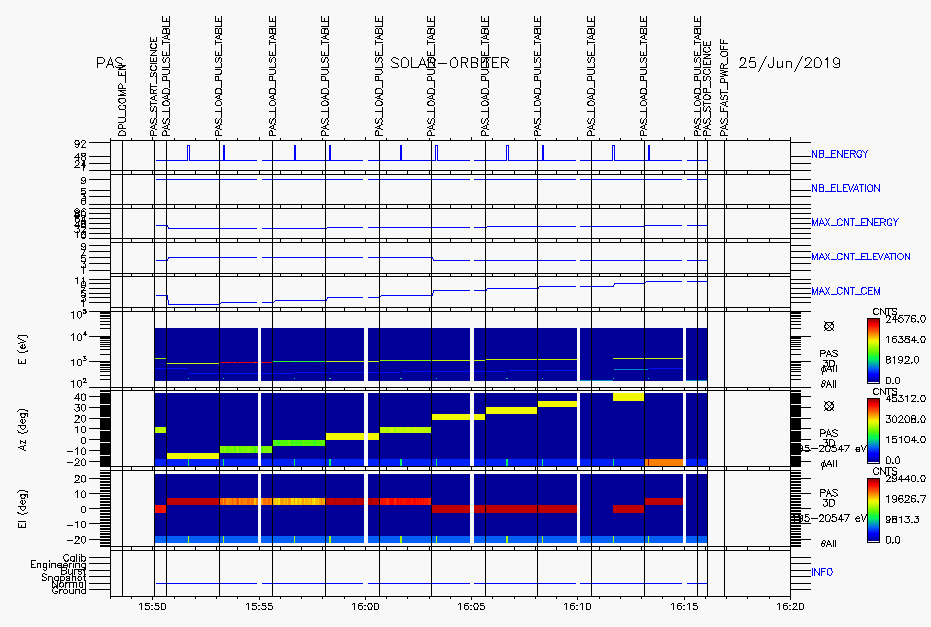
Spectrograms looks fine now, plots are very similar, but we can find greater values for uncompressed PAS 3D data (second part of test starting at 15:50), than during the first part of the test (15:20/15:45).
You will find below a plot for the two periods.
We display also the different TCs on the plots.
Data plot from PAS RAW data (not compressed)
This first plot shows PAS data during the first part of the test.
Generated form PAS normal mode and Snaphot mode.
Sending pulses but without compression enable.

Data plot from uncompressed PAS data
This first plot shows PAS data during the second part of the test, after eneabling compression.
Actually, only normal mode is taking in account (no Snaphot)

Log of 3D counts
PAS 3D CDF logfile
Logfile of generated CDF records for PAS 3D CDF file.
It gives timetags, modes, description of 3D distributions (nb.energy x nb.CEM x nb.elevations), K…
Data processing logfile
This logfile gives details of data processing software, with an hexadecimal dump of each packet for PID = 195.
It gives also detail of fields extracted in the packet :
-
number of CDS
-
LCI
-
packet size…


